Find the mean, median, mode IQR, Q1, Q3 and standard deviation.
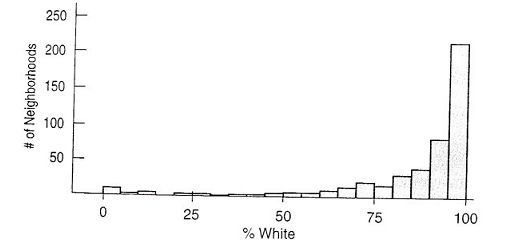
A large philanthropic organization keeps records on the people who have contributed to their cause. In addition to keeping records of past giving, the organization buys demographic data on neighbourhoods from the U.S Census Bureau. Eighteen of these variables concern the ethnicity of the neighbourhood of the donor. Here are histogram and summary statistics for the percentage of whites in the neighbourhoods of 500 donors:
|
Count
|
500
|
|
Mean
|
83.59
|
|
Median
|
93
|
|
stdDev
|
22.26
|
|
IAR
|
17
|
|
Q1
|
80
|
|
Q3
|
97
|
a) Which is a better summary of the percentage of white residents in the neighbourhoods, the mean or the median? Explain.
b) Which is a better summary of the spread, the IQR or the standard deviation? Explain
c) From a normal model, about what percentage of neighbourhood should have a percent white within one standard deviation of the mean?
d) What percentage of neighbourhoods actually has a percent white within one standard deviation of the mean?
e) Describe the discrepancy between parts c and d.