1) 2 + 2 = 5 is
i) a normative statement.
ii) a moral judgment.
iii) correct, given common assumptions.
iv) a positive statement.
2) The increase in consumer incomes would lead to
i) a rightward shift of the demand curve for plasma TVs.
ii) a movement upward along the demand curve for plasma TVs.
iii) a rightward shift of the supply curve for plasma TVs.
iv) no change of the demand curve for plasma TVs.
3) As the price of good increases, change in the quantity demanded could be shown by
i) shifting the demand curve leftward.
ii) shifting the demand curve rightward.
iii) moving down along the same demand curve.
iv) moving up along the same demand curve.
4) If the price of automobiles were to increase substantially, demand curve for gasoline will most likely
i) shift leftward.
ii) shift rightward.
iii) remain unchanged.
iv) become steeper.
5) An increase in demand curve for orange juice will be shown as a
i) leftward shift of the demand curve.
ii) rightward shift of the demand curve.
iii) movement up along the demand curve.
iv) movement down along the demand curve.
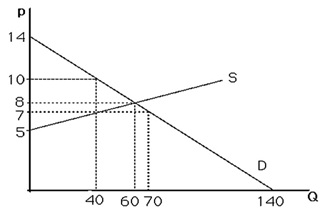
6) The above figure shows the graph of the market for pizzas in a large town. No pizzas would be demanded unless price is less than
i) $0.
ii) $5.
iii) $12.
iv) $14.
7) The above figure shows the graph of the market for pizzas in a large town. If the price falls from $10 to $7 per pizza, the quantity of pizzas demanded will
i) increase by 20.
ii) decrease by 30.
iii) increase by 30.
iv) decrease by 10.
8) Suppose the price of a movie is $10. Jenna demands 2 movies per week, Sam demands 3 movies per week, and Jordan demands 8 movies per week. From this information we could conclude that
i) the market quantity demanded at a price of $10 is at least 13 movies per week.
ii) Jordan is obviously wealthier than either Sam or Jeanna.
iii) Sam is irrational compared to Jenna or Jordan.
iv) the movie industry is unprofitable.
9) Assume the demand curve for a good shifts rightward, causing the equilibrium price to increase. This increase in the price of the good results in:
i) a rightward shift of the supply curve.
ii) an increase in quantity supplied.
iii) a leftward shift of the supply curve.
iv) a downward movement along the supply curve.
10) The above figure shows the graph of the market for pizzas in a large town. At a price of $14, there would be
i) no pizzas supplied.
ii) equilibrium.
iii) excess supply.
iv) excess demand.
11) The above figure shows a graph of the market for pizzas in a large town. At a price of $5, there would be
i) excess demand.
ii) excess supply.
iii) equilibrium.
iv) zero demand.
12) The above figure shows the graph of the market for pizzas in a large town. What are the equilibrium price and quantity?
i) p = 8, Q = 60
ii) p = 7, Q = 40
iii) p = 7, Q = 70
iv) p = 10, Q = 40
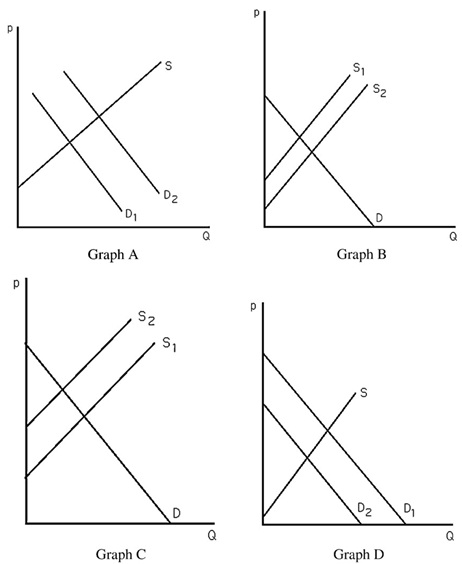
13) The above figure shows four different markets with changes in either the supply curve or the demand curve. Which graph best illustrates the market for coffee after severe weather destroys a large portion of the coffee crop?
i) Graph A
ii) Graph B
iii) Graph C
iv) Graph D
14) The above figure shows four different markets with changes in either the supply curve or the demand curve. Which graph best illustrates the market for tea after severe weather destroys a large portion of the coffee crop?
i) Graph A
ii) Graph B
iii) Graph C
iv) Graph D
15) The above figure shows four different markets with changes in either the supply curve or the demand curve. Which graph best illustrates the market for non-dairy coffee creamer after severe weather destroys a large portion of the coffee crop?
i) Graph A
ii) Graph B
iii) Graph C
iv) Graph D
16) The above figure shows four different markets with changes in either the supply curve or the demand curve. Which graph best illustrates the market for computers after technological advances in making computers occur?
i) Graph A
ii) Graph B
iii) Graph C
iv) Graph D
17) The above figure shows four different markets with changes in either the supply curve or the demand curve. Which graph best illustrates the market for computer manuals after technological advances in making computers occur?
i) Graph A
ii) Graph B
iii) Graph C
iv) Graph D
18) The above figure shows four different markets with changes in either the supply curve or the demand curve. Which graph best illustrates the markets for typewriters after technological advances in computerized word-processing software occur?
i) Graph A
ii) Graph B
iii) Graph C
iv) Graph D
19) Suppose the market for grass seed can be expressed as
Demand: QD = 100 - 2p
Supply: QS = 3p
If government imposes a $5 specific tax to be collected from sellers, what is the price consumers will pay? How much tax revenue is collected? What fraction is paid by sellers?
20) The market demand for wheat is Q = 100 - 2p + 1pb + 2Y. If the price of wheat, p, is $2, and the price of barley, pb, is $3, and income, Y, is $1000, the income elasticity of wheat is
A) 2 * (1000/2099).
B) 2.
C) 1/2 * (1000/2099).
D) cannot be calculated from the information provided.
21) The cross price elasticity of demand for a good is the percentage change in the quantity demanded in response to a given percentage change in
A) income.
B) the price of that good.
C) the price of another good.
D) the quantity demanded of another good.
22) A horizontal demand curve for the good can arise because consumers
A) are irrational.
B) are not sensitive to price changes.
C) view this good as identical to another good.
D) have no equivalent substitutes for this good.
23) If price of orange juice rises 10%, and as a result the quantity demanded falls by 10%, then one could conclude that demand for orange juice
A) is perfectly elastic.
B) is inelastic.
C) has a unitary elasticity.
D) has a constant elasticity.
24) Assume demand function for a good is expressed as Q = 100 - 4p. If the good currently sells for $10, then the price elasticity of demand equals
A) -1.5.
B) -0.67.
C) -4.
D) -2.5.