Assignment: Figure (below and at https://bit.ly/hHzMfm) is a process-flow representation of Earth’s energy balance. Based on Figures 2.15 and 2.16 of Ahrens, or Figures 2.17 and 2.18 of Ahrens et al., each of Space, Atmosphere and Earth is represented as a source/sink for energy-transfer processes in figure below.
Question a) In Figure below:
i) List all processes that transfer energy via radiation.
ii) List all non-radiative processes that transfer energy.
iii) Grouping by each of the four steps identified (the numbers in figure below), itemize the 12 source-process-sink relationships.
Question b) Figure (https://bit.ly/h5Bj4t) is the Base representation of the Energy Balance Climate Model (EBCM). Figure (https://bit.ly/fo3Dk9) is a scenario for a 2% increase in CO2 - the only changes in Figure three versus Figure two are the differences in the entries for cells C31 and C32 in Figure 3. Based on a comparison of Figures two and three:
i) State the resulting temperature difference in oC.
ii) State the resulting increase in the concentration of CO2 in ppm.
iii) Using Figure first, explain the temperature and [CO2] impact in terms of process flows.
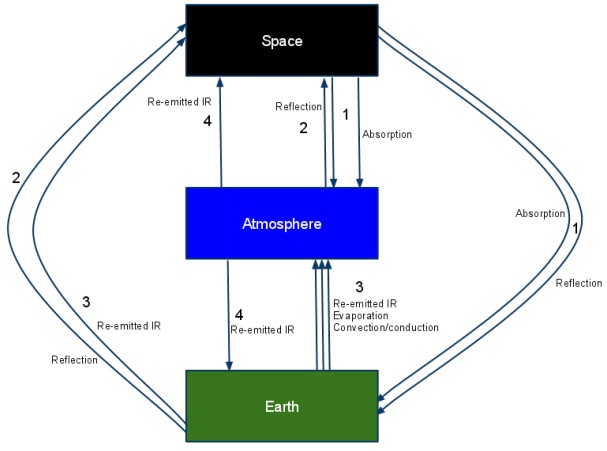
Figure: Process-flow diagram for Earth’s energy balance. For a larger version of this figure, see https://bit.ly/hHzMfm.
Question c) Table (below) provides a tabulation of reflected energy (W/m2) as a function of temperature difference (oC) based on modeling with EBCM.
i) Create a graph of temperature difference (vertical axis) against reflected energy (horizontal axis).
ii) Determine the largest, negative temperature difference over the past 400,000 years from the Vostok ice core data at https://bit.ly/fue5rO. State this value.
iii) Using the graph created in 1(c)(i), estimate the energy reflected for the largest, negative temperature difference identified in 1(c)(ii).
iv) Determine the ratio of reflected energy as a percentage for the result obtained in 1(c)(iii) relative to the current value (i.e., the value corresponding to a temperature difference of 0 oC in Table).
v) Using Figure first, explain the reflected-energy ratio derived in 1(c)(iv) in terms of process flows.
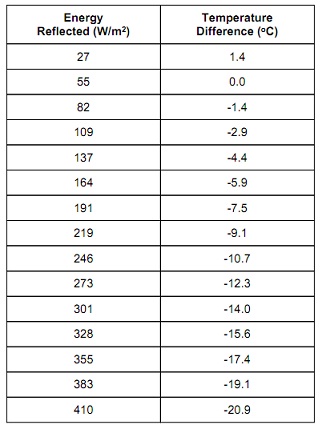
Table: Reflected energy as a function of temperature difference as modeled by EBCM. The 0.0 value of temperature difference corresponds to the current value - as provided by Ahrens Figures 2.15 and 2.16, or Figures 2.17 and 2.18 of Ahrens et al.
Question d) Based on the solar irradiance versus time data available at https://bit.ly/gSLHbe, Earth has experienced a 2 W/m2 variation over the past 30 years.
i) Acquire a copy of the EBCM model. Change the value of the solar constant (cell D4) from 1367 W/m2 to 1365 W/m2, allow the spreadsheet to recalculate, and state the resulting temperature difference (cell D6) in oC.
ii) Using Figure first, explain the result derived in 1(d)(i) in terms of process flows.
iii) Calculate the percentage change implied by use of 1365 W/m2 for the solar constant in 1(d)(i).
iv) Based on the results obtained in 1(d)(ii) and 1(d)(iii), what can be concluded about variations in solar irradiance - and therefore the solar constant.
Question e) Based on the climatic data available from The Weather Network for Toronto online at https://bit.ly/fWNCgx:
i) Using just the average temperature data, classify the climate of Toronto according to Koppen’s Climatic Classification System (KCCS, Ahrens, 5th Edition, Appendix G or Ahrens et al., 1st Canadian Edition, Table 17.1). Justify.
ii) Based on modeling with EBCM, a 3% increase in [CO2] will result in a 2oC increase in temperature. If this 2oC increase in temperature applies to the average temperature data for Toronto, what is the resulting climatic classification based on KCCS? Justify.