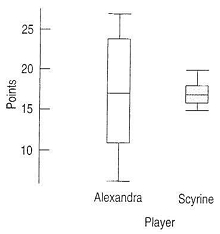
Five number summary and box plot
The following are 80 measurements of the daily emissions (in tons) of sulfur dioxide from an industrial plant.
|
15.8
|
26.4
|
17.3
|
11.2
|
23.9
|
24.8
|
18.7
|
13.9
|
9
|
13.2
|
|
22.7
|
9.8
|
6.2
|
14.7
|
17.5
|
26.1
|
12.8
|
17.6
|
17.6
|
23.7
|
|
26.8
|
22.7
|
22.7
|
20.5
|
11
|
20.9
|
15.5
|
16.7
|
16.7
|
10.7
|
|
19.1
|
15.2
|
15.2
|
26.6
|
20.4
|
21.4
|
19.2
|
16.9
|
16.9
|
19
|
|
18.5
|
23
|
23
|
20.1
|
16.2
|
18
|
7.7
|
23.5
|
23.5
|
14.5
|
|
18.4
|
29.6
|
29.6
|
17
|
20.8
|
24.3
|
22.5
|
18.4
|
18.4
|
18.1
|
|
8.3
|
21.9
|
21.9
|
22.3
|
13.3
|
11.8
|
19.3
|
25.7
|
25.7
|
31.8
|
|
25.9
|
10.5
|
10.5
|
27.5
|
18.1
|
17.9
|
9.4
|
20.1
|
20.1
|
28.5
|
Note. Please consider the measurements: 6.2, 7.7, 8.3, 9.0, 9.8 and any other tens digit as 06.2, 07.7, 08.3, 09.0, and 09.8 respectively so that each measurement is a 3-digit character. Using the first two digits of the measurement as your stem, construct a stem and leaf show of the data above.
Using the display determine the following
i) The median Q2.
ii) The 1st quartile Q1
iii) The 3rd Quartile Q3
iv) The inter-quartile range, Q3-Q1

Illustrate a Box and Whisker plot and label completely indicating items i-iv in the plot as well as the lower and upper whiskers and also the outliers and the extreme outliers.