Problem:
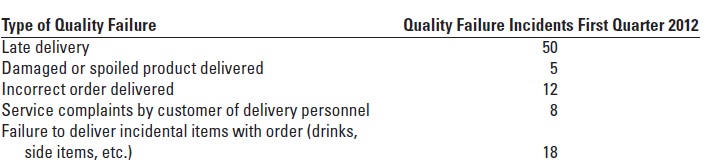
Quality improvement, Pareto diagram, cause-and-effect diagram. Pauli's Pizza has recently begun collecting data on the quality of its customer order processing and delivery. Pauli's made 1,800 deliveries during the first quarter of 2012. The following quality data pertains to first quarter deliveries:
Required
1. Draw a Pareto diagram of the quality failures experienced by Pauli's Pizza.
2. Give examples of prevention activities that could reduce the failures experienced by Pauli's.
3. Draw a cause-and-effect diagram of possible causes for latedeliveries.