Assignment:
Please use a word processor such as Microsoft Word, Apple Pages or OpenOffice for your answers. If you have trouble editing the graphs, you can also sketch them on paper, take pictures of them and then insert the pictures in your file. Please make sure that the graphs are readable.
1) Table 1 below describes the revenue that a monopolist is able to make for different levels of output (denoted by Q). The total cost (TC) for a given value of output Q is given by the formula: TC = 20 + Q + Q2 (in words, total cost is given by twenty plus the level output plus the square of the level of output).
a) Complete the table.
b) Determine the profit-maximizing level of output.
c) At the profit-maximizing level of output, what is the marginal revenue and what is the marginal cost? (Hint: the marginal revenue, for, say, Q=1 is the extra revenue that can be obtained by producing an additional unit). Compute these values and show how they are related to the choice of the profit-maximizing level of output.
d) At the profit-maximizing level of output, what is the price the monopolist charges (assume that the monopolist charges the same price for each unit of output he sells)? Is this price higher or lower than the marginal cost? Is the quantity produced by the monopolist efficient? How is this outcome different from the outcome of a competitive market?2) In the incoming election, Massachusetts voters will have the option to liberalize marijuana in their state. According to news reports, the Massachusetts alcohol industry is contributing money against the legalization of marijuana.
Table 1
|
Output (Q)
|
Total Revenue
|
Total Cost (TC)
|
Profit
|
|
1
|
$90
|
_____
|
_____
|
|
2
|
160
|
_____
|
_____
|
|
3
|
210
|
_____
|
_____
|
|
4
|
240
|
_____
|
_____
|
|
5
|
248
|
_____
|
_____
|
|
6
|
240
|
_____
|
_____
|
|
7
|
210
|
_____
|
_____
|
|
8
|
160
|
_____
|
_____
|
|
9
|
90
|
_____
|
_____
|
a) Given these news reports, does the Massachusetts alcohol industry consider alcohol and marijuana substitutes or complements? What does the industry believe would happen to the demand for alcohol in Massachusetts with the liberalization of marijuana: shift left, right or remain constant?
b) Given these news reports, which model do you think is most appropriate for the alcohol market in Massachusetts: Monopoly, oligopoly, monopolistic competition or perfect competition? Briefly explain.
3) Coal plants are the nation's top source of carbon dioxide (CO2) emissions.
a) For simplicity, assume that the coal market is perfectly competitive and draw a standard upward-sloping supply and downward-sloping demand diagram to represent the equilibrium in the coal market. Clearly label the axes, the curves, and the equilibrium.
b) Is this equilibrium socially efficient? If coal plants were to pay a tax of, say, 10 cents for each ton of (CO2) emission they produce, how would the equilibrium in the market be affected? If needed, modify your graph to answer this question, clearly indicating the new equilibrium quantity and price. Do you think that this new equilibrium would be more efficient? Briefly explain your answer.
c) What happens to the profits of coal plants if the tax is approved?
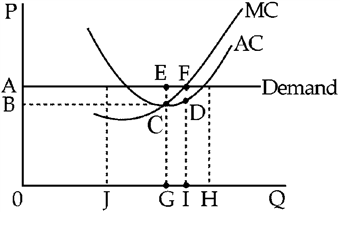
Figure 1 above represents the marginal cost (MC) and average total cost (AC) curves for a firm. The demand faced by the firm is a horizontal line. The firm can sell any amount it wants at price A.
a) Which is the profit maximizing level of output for this firm?
b) Represent on the graph the total profits earned by the firm while producing this optimal level of output.
5) This question refers to the efficiency properties of perfectly competitive markets. For example, consider a specific market where P is the price, MC is the marginal cost of producing an additional unit and MU is the marginal utility derived from consuming an additional unit.
A. Suppose that at first P > MC. Is this an equilibrium? Will producers have an incentive to increase or decrease production? Argue that eventually P = MC will prevail.
B. Suppose at first that P < MU. Are the consumers maximizing their utility? In particular, do they have an incentive to increase or decrease consumption? Argue that eventually P = MU will prevail.
C. Combining your answer in A and B, show that in a competitive market MC = MU. Explain why this means that the market is efficiently allocating resources.
6) Suppose that there are only two types of drivers: high-risk drivers, who have a higher chance of accidents, and low-risk ones who have a lower chance of accident. Suppose also that car insurance companies cannot tell apart these two groups (for example, this will be true for young drivers who do not have a driving history yet). For this reason they will have to charge the same premium to both groups.
a) If car insurance were not mandatory, then, which group of drivers would you expect not to buy insurance and why? If this group opts not to buy insurance, how would insurance premiums be affected? Discuss using the concept of adverse selection. How would making car insurance mandatory alleviate adverse selection issues?
b) A cornerstone of the recent health care reform is the individual mandate: individuals have to obtain coverage or pay a penalty. Use a reasoning similar to the one you used for question a) in order to explain why the architects of the reform thought that an individual mandate was necessary (as a side, note that this is not a question about the virtues, or lack thereof, of the Affordable Care Act; it is just a question about the logic of including the mandate in the reform).
c) Now back to car insurance. In Massachusetts car insurance is mandatory, with a required minimum limit of coverage. A driver maychoose to insure for a higher amount. If a driver injures someone by driving, then his insurance company will be able to provide some compensation to the injured person, up to the insured amount. Explain how the choice of the amount to insure affects not only the driver but also other road users: in other words, it is an externality. Using the concept of private marginal benefit and social marginal benefit, explain why it is likely that drivers will insure less than the socially optimal amount.
7) Consider a firm operating in a monopolistically competitive market. We are interested in the long-run equilibrium. Figure 2 below represents the marginal cost (MC) curve for this firm and the demand faced by the firm in the long-run.
a) Q* is the output that the firm opts to produce in this long-run equilibrium. Add the marginal revenue (MR) curve to the figure: the placement of the MR curve should be consistent with the fact that Q* is the optimal production output for the firm.
b) Clearly indicate in your graph the price P* that the firm will charge to sell Q*. Explain how you find that price using the relevant curves.
c) Add to the graph the average total cost curve (ATC).
..jpg)