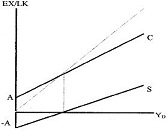
Drawing Keynesian Cross Diagram.
Ion the graph you will see both a consumption function and a savings function "graphed." The Intercept "A" represents total Consumption spending when YD=0. If households spend. A when YD=0 then savings function. If for each additional dollar earned househo9lds spend MPC=C/ YD. We can put these two pieces together to write the savings function: S=-A+MPS YD. This equation is also "graphed." Notice that the Consumption spending when YD=0. If households spend A when YD =0 then savings must be "A." that is the intercept of the savings function. If for each additional dollar earned households spend A MPC = C/ YD, then the rest muist go to savings, or MPS = S/ YD. When can put these piece together to write the savings function: S=-A+MPS YD. This equation is also "graphed." Notice that wen the consumption function intersects the 45 Degree C= YD-spend entire income - so S=0.
Consider the following macroeconomics data:
C=1000+0.75 YD
I+G=800
YF= 10,000
Task 1. Use Keynesian Cross Diagram to graph C, S and I+G.
Task 2. Describe the equilibrium level of disposable national income.
Task 3. Assume macronomic performance.