Use the diagram below, that shows the demand and supply of labour in the sugar industry, to answer Question1.
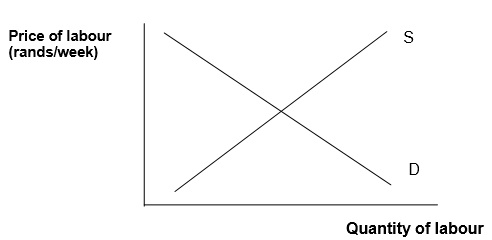
1) If there is a minimum wage in this industry (above equilibrium wage/price), then the effect of removing this minimum wage would be to
i) increase the equilibrium price and increase the quantity of labour demanded.
ii) decrease the equilibrium price and remove the shortage of labour.
iii) decrease the equilibrium price and remove the surplus of labour.
iv) increase the equilibrium price and cause a shortage of labour.
v) None of the above.
Use the figure below to answer Question2.
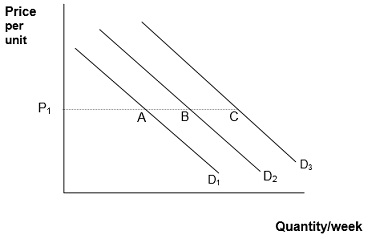
2) Rank the absolute value of the coefficient of the price elasticity of demand, from highest to lowest, across points A, B and C. The correct ordering is
i) A, B and C.
ii) A, C and B.
iii) C, B and A.
iv) B, A and C.
v) The coefficients are the same at A, B and C.
3) Ceteris paribus, every time the price of cashew nuts falls by R1/kg, the quantity of cashew nuts demanded increases by 10kg per day. From this we can infer that
i) the demand curve for cashews is not linear.
ii) the higher the price of cashews, the more price inelastic the demand curve becomes.
iii) the price elasticity of demand for cashews is constant.
iv) as price rises, demand at first becomes more price elastic and then later becomes less price elastic.
v) as price falls, demand becomes less price elastic.
4) If an individual’s income rises by 10%, ceteris paribus, his/her demand for a luxury good
i) increases by more than 10%.
ii) decreases by more than 10%.
iii) remains unchanged.
iv) increases, but by less than 10%.
v) cannot be predicted with out additional information.
5) Ceteris paribus, if a 10% increase in income has caused a 20% decrease in the quantity of paraffin demanded (at the current price), then from this we can conclude that paraffin is
a. price elastic.
b. a necessity.
c. a luxury good.
d. an inferior good.
e. price inelastic.
6) The following table represents the total utility for bread, butter and milk consumed by John. Derive John’s consumer equilibrium position for the three goods where the price of butter is R5 per unit, the price of bread is R1 per unit and milk is R4 per unit. John’s available income is R37.
You must show all your workings.
Butter Bread Milk
1 21 7 23
2 41 13 40
3 59 18 52
4 74 22 60
5 85 25 65
6 91 27 68
7 91 28,2 70