Solve the following problem:
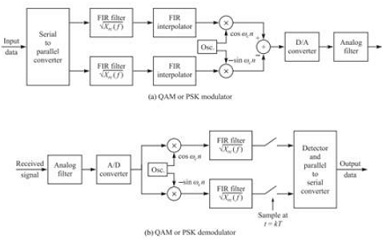
Figure illustrates a block diagram of a QAM or PSK modulator and demodulator (modem) in which the modulated signals are synthesized digitally and demodulated digitally. The FIR filters have square-root raised cosine spectral characteristics and employ a sampling rate of 2/T , where the symbol rate 1/T = 2400 symbols/s. The FIR interpolators employ a sampling rate of 6/T and are designed as linear phase FIR filters that pass the desired signal spectrum.
a. Write a software program that implements the digital modulator in Figure for the following parameters: roll-off factor β = 0.25, length of FIR shaping filter = 21, length of FIR interpolator = 11, carrier frequency fc = 1800 Hz.
b. Generate 5000 samples of the digital signal sequence xd (n) and compute and plot the power spectral density of this modulated signal.
c. Repeat (b) for five more iterations and compute the average power spectrum over the total of six signal records. Comment on the results.