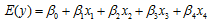
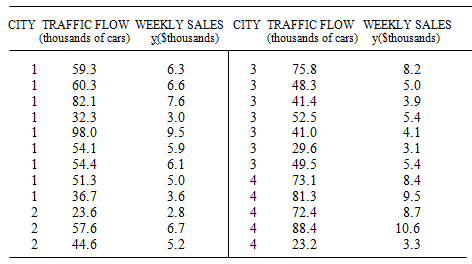
A fast food restaurant chain is interested in modeling the mean weekly sales of a restaurant, E(y), as a function of the weekly traffic flow on the street where the restaurant is located and the city in which the restaurant is located. The table contains data that were located on 24 restaurants in four cities. The model that has been proposed is
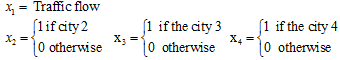
where
1. Write the equation of the model based on the above data. Interpret the coefficients of the model in the context of the problem.
2. If the traffic flow in front of all stores is the same, 80,000 cars, predict sales for city 1 and city 4, based on the fitted model. Which of the four city stores have the least expected sales?
3. Use the prediction equation to graph (by hand) the response lines that relate predicted weekly sales, y1, to traffic flow, x1, for each of the cities.
4. Write a model that includes interaction between city and traffic flow.
5. Fit the model of part 4 to the data.
6. Graph the interaction model, by hand.