a) Open SAS. In the editor window type the commands below and save this as ass3.sas in your H:\stats301\A3 directory (if this doesn't exist then create it!):
/* This is the STATS301 start up file */
*Set up title on line 1;
TITLE1 "STATS 301: &sysuserid";
*Specify SAS library for storing permanent SAS datasets; LIBNAME stats301 "H:\stats301\A3";
The TITLE1 command his will ensure that your user ID is on all relevant output - if it is not present students will receive NO MARKS for all work. The LIBNAME statement allows you to save permanent copies of ay data sets you create.
In the following we wish to take you from a specific task to a general solution by identifying the general features that can be transferred across similar enquiries. In particular, we want to automate the production of ‘nice' (.rtf) output from these enquiries via the use of SAS MACROs.
Q1
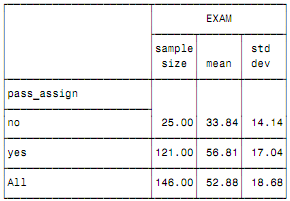
(a) In the following, we will be re-visiting the data set Stats20x that you investigated in assignment 1. The following code can be use to produce a table of the sample size (n), average (mean) and standard deviation (s) for a numerical variable (in this example exam score) for each level of a classification/factor (in this case whether the student passed the assignment - pass_assign=yes or no). Run the code below to reproduce the outputted table that you see below it.
Code:
PROC TABULATE DATA = stats20x FORMAT=6.2;
CLASS pass_assign;
VAR Exam;
TABLE pass_assign all ,Exam*(N='sample size' Mean='mean' std='std dev');
TITLE 'Pass assignment versus Exam';
RUN;
Output:
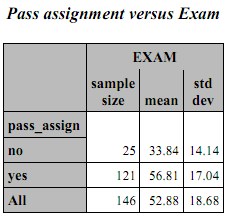
(b) Run this code again except this time make sure you are creating an .rtf file with the in an appropriate folder with this table in it.
Hint: ODS. You should have a suitably named .rtf file that has the following chart placed in it:
(c) What we would like to do is create similar tables in an .rtf file that produces the same statistics for any numerical value against each level of a know classification/factor from any data set we wish to inspect.
Use MACRO variables to generalise the example above.
To illustrate: in the above code we may decide that the variable Exam can change to any other numerical (e.g. the student test score). So we may generalise this numerical variable -let's call it, ay, y. So we generalise the above code by:
%LET y=Exam; ** we could change this to any other numerical variable e.g. test;
PROC TABULATE DATA = stats20x FORMAT=6.2;
CLASS pass_assign;
VAR &y;
TABLE pass_assign all ,&y*(N='sample size' Mean='mean' std='std dev');
TITLE 'Pass assignment versus Exam';
RUN;
Your task is to create macro variables that allow you to generalise this ODS RTF output to any general data set (found in a suitably named folder) that produces output like the above on a numerical variable for each level of a classification/factor variable. It will need a suitable title.
(d) Hence, create a SAS MACRO that allows you produce the same sort of tables in .rtf format. Produce the MACRO code and illustrate its use by producing 3-4 similar tables for various combinations of numerical and classification variable (One example could be, say, Test versus gender).
Q2
Study the following website on non-linear modelling (as well as the help file for PROC NLIN in SAS);
(a) In no more than one or two paragraphs, and in your own words, (no cut and pasting please) describe how a non-linear model differs from a linear model.
(b) In no more than one or two paragraphs, and in your own words, (no cut and pasting please) describe which components of a non-linear model are the same as for a linear model.
(c) Hence, what criterion is being used to determine the ‘best' estimates?
Attachment:- stats20x.rar