1 State Prices (or Arrow-Debreu prices)
Suppose that there are three states and three assets. Asset 1 sells for $1:60 and has payoffs across the three states given by (1, 2, 3). Asset 2 sells for $1:80 and has payoffs (2, 1, 5). Asset 3 sells for $3:00 and has payoffs
(5, 3, 4).
(a) Write down the security payoff matrix X and the vector of prices p.
(b) What is the rank of the payoff matrix X? Is the market complete?
(c) Derive the vector of state prices q. (You may use a calculator or computer to compute the inverse of X).
(d) Is there an arbitrage opportunity?
(e) Suppose the probabilities over the states are given by � = (1=3, 1=4, 5=12). What is the vector of state price densities?
(f) What is the riskfree rate 1 + rf ?
(g) What are the risk-neutral probabilities?
(h) Value the asset y = (5, 5, 10)
2 State-Price Densities
Suppose that there are three states with probabilities � = (1=2, 1=4, 1=4)
and suppose that the vector of state price densities is given by m = (0:4, 0:8, 2)
(a) Value the asset y = (2, 1, 2) using the pricing formula p (y) = E [my].
(b) What are the state prices q? Is there an arbitrage opportunity?
(c) What is the risk-free rate 1 + rf ?
3 Risk-Neutral Probabilities
Suppose that there are four states with risk neutral probabilities
��= (:1, :5, :3, :1) and a risk free rate of 1 + rf = 1:1
(a) Value the asset y = (0, 5, 1, 2) using the valuation equation p (y) = 1 1+rf E� [y].
(b) What are the state prices q? Is there an arbitrage opportunity?
4 Three states, Two securities
Suppose that there are three states and two securities. There is a risk-free asset with payoffs (1, 1, 1) which sells at a price $0:75, and a risky stock with payoffs (3, 4, 6) which sells at a price of $2.
(a) Write down the security payoff matrix X. Is the market complete?
(b) State prices (q1, q2, q3) must be a solution to the system of equations p0= q0X. Write out this system of equations, and solve for state prices q1 and q2 as a function of q3.
(c) What restrictions can we put on the value of q3 so that the security prices exclude arbitrage?
5 A Simple Consumption-Based Asset Pricing Model
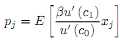
There are two periods, t = 0, 1. Suppose there are two assets and two states. There is a price vector at time 0 for these assets given by and a payoff matrix associated with these assets. The probabilities over states are given by
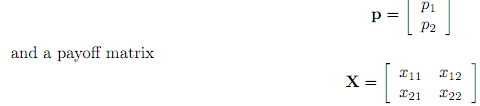
the vector � = (�1, �2) 0. Assume that
the security prices exclude arbitrage.
We consider the problem of an agent with initial wealth w0.
(a) First, suppose that the agent does not consume at t = 0, and only consumes at t = 1. The budget constraint for the agent with initial wealth w0 is thus given by p0
a =p1a1 + p2a2 = w0
Plot the feasible set of consumption bundles in a state-space graph, in which the axes are given by the wealth in the two future states w1 (s1) and w1 (s2). Label the two points that represent the gross returns of the two assets. The frontier of all feasible consumption bundles should be the line that goes through these two points.
(b) Now suppose that the agent consumes both at t = 0 and at t = 1. Thus, the agent faces a consumption- portfolio choice problem
subject to where c1 is the agentís vector of consumption at t = 1 in the two states and h =(h1, h2) 0 is the agentís vector of asset holdings. That is, hj is the number of shares of asset j the agent chooses to purchase at t = 0.
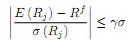
Take first order conditions and show that for any asset j = 1, 2, we can write
(c) We know that any asset can be priced by the pricing equation p (y) = E [my]. Given the agentís portfolio choice problem in part (b), what is m equal to? Give intuition for what m represents.
(d) Returns for any asset are defined as Rij = xij=pj . Using this, show that equation (1) is equivalent to the usual Euler equation.
(e) Finally, suppose that we define Rf = 1 + rf as the gross risk-free rate. Show that and explain intuitively why we can determine a risk-free rate even if a riskless bond is not traded in the market.

6 The Equity-Premium Puzzle
In class we derived from our consumption-based asset pricing model the following relationship between (i) the Sharpe ratio for any asset, (ii) the CRRA coefficient , and (iii) the standard deviation of consumption growth�:
We can explore how this equation relates to the data. In particular, we apply this formula to a market-portfolio of U.S. stocks.
Suppose that we look at historical data on real stock returns in the post-war period, and we find that average real stock returns are approximately 7% per year, with a standard deviation around 15%. Furthermore, we find that the average risk free rate on Treasuries is about 1% per year.
For consumption we look at aggregate non-durables and services. We find that real consumption growth has a mean of about 1.5% per year and a standard deviations of 1%.
(a) Given these facts, what is the Sharpe ratio on a portfolio of US Stocks?
(b) What is the lowest value for such that these numbers from the data are consistent with equation (2)?
(c) Finally, if we look at micro evidence and laboratory experiments, we find that most estimates for the CRRA parameter hover around 1 or 2. If this is true, then explain why equation (2) along with the historical data constitute a puzzle, known as the equity premium puzzle.