Assignment:
1. Graph the typical AFC curve. Explain why the AFC has this shape.
2. Below is a graph including a firm's two potential ATC curves-- one given that they have a small factory (i.e. ATC SMALL) and one given that they have a big factory (ATC BIG). The firm initially has a small factory, is selling 100 units, and is breaking even.
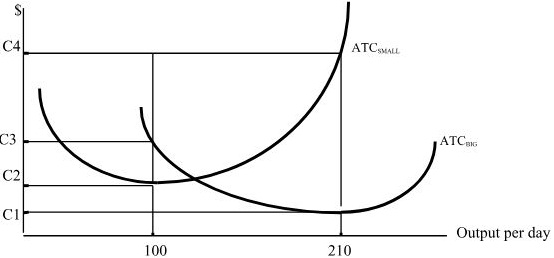
a. If they were initially breaking even, what price were they selling at with the small factory?
b. Suppose the market changes and now the firm will be selling 210 units indefinitely. In the Long Run, a firm can choose its fixed costs (i.e. its factory). In the Long Run, should the firm keep producing with a small factory or switch to the big factory, given that they are selling 210 units? Explain.
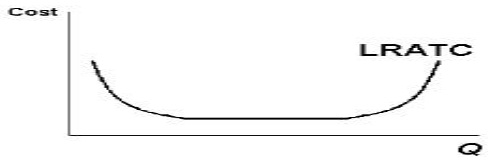
3. The graph below shows the Long Run Average Total Cost curve for a firm. Label or indicate what part of the curve exhibits Increasing Returns to Scale, Constant Returns to Scale, and Decreasing Returns to Scale. Then, give one reason why a firm's LRATC curve might have Increasing Returns to Scale and one reason why it might have Decreasing Returns to Scale.
4. Circle the correct answer to complete the following sentences:
a. A perfectly competitive industry has (one, a few, many) buyers and sellers.
b. The product in a perfectly competitive industry is (standardized, differentiated).
5. a. What is the optimal output rule?
b.. What is a price-taker?
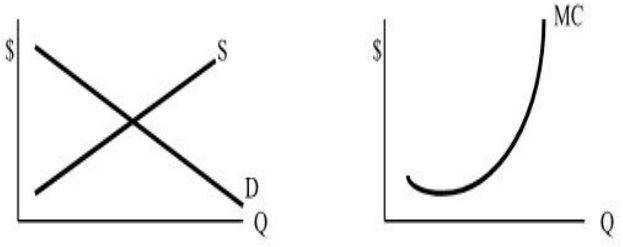
c. What aspect of the graph below illustrates (or is a result of the fact) that the firm is a price-taker?
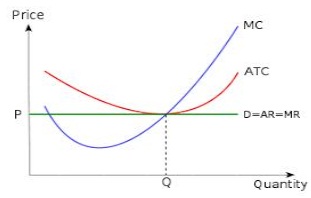
d. On the graph above, the firm is producing at quantity Q, where D=AR=MR=MC.
Explain why this amount is profit-maximizing by explaining why producing less is suboptimal and? by explaining why producing more ?is suboptimal.
6. a. Suppose there is a perfectly competitive firm in the market for apples. This firm makes apples by hiring workers that collect the apples from a massive apple orchard -- and they pay each worker $400 per day. The table below includes how many workers the firm needs to hire to produce various amounts of apples, along with the firm's Fixed Cost. Complete the table. ?
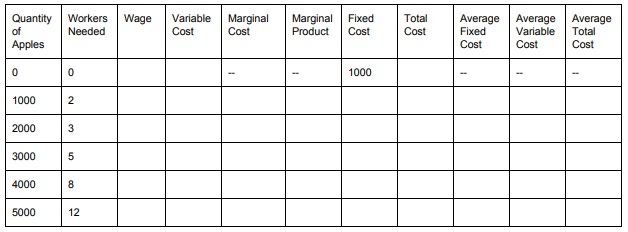
b. Assume the firm can only sell the exact amount of apples listed in this table. What's its breakeven price? What's its shutdown price?
c. Suppose the market price for an apple is $1 and the firm can sell as many apples as it wants at the current price. Using the information from 6a, complete the following table.
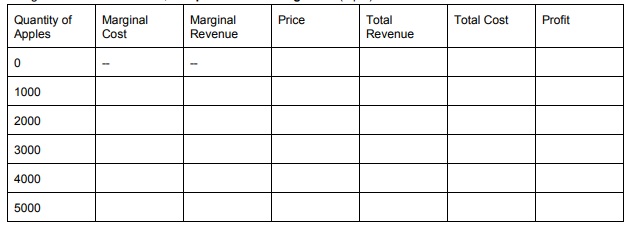
d. At a price of $1, what's the profit maximizing quantity? And how does that relate to the Marginal Cost and Marginal Revenue values?
e. Suppose the market price for an apple is $.5 and the firm can sell as many apples as it wants at the current price. Using the information from 6a, complete the following table.
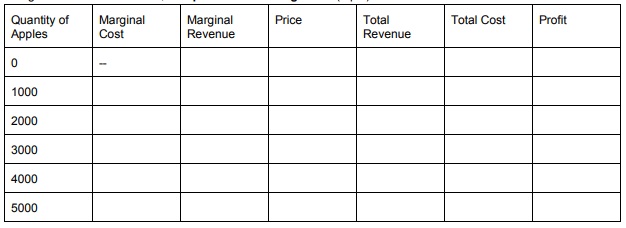
f. At a market price of $.5, what's the profit maximizing quantity?
7. a. On the graph below:
? Set the price at a level where the firm is making positive profits.
? Indicate where the breakeven price and where the shutdown price are.
? Graphically depict the firm's profits.
b. Where on the graph above is the firm's Short-Run Supply Curve?
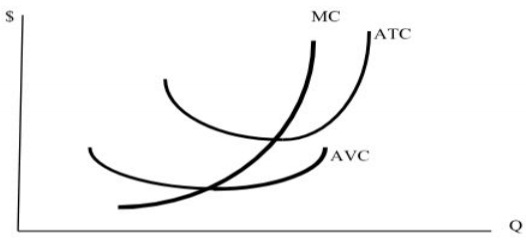
8. On the graph below:
? Draw the firm's demand curve.
? Draw the AVC and ATC curves such that the firm is making negative profits (or losses), but still finds it worth producing. (Be sure to correctly related the ATC and AVC with the MC).
? Draw the firm's negative economic profits.