1. There are four types of data-nominal, ordinal, interval, and ratio. Identify the type of data for each example below and put the name of the correct type in the space provided to the right.
a. The number of rapes by cities in the U.S. _____________________
b. Ages of people across the entire U.S. by years old _____________________
c. Sex, e.g., male, femaler _____________________
d. Race and ethnicity, e.g., white, black, Hispanic, other _____________________
e. Temperature by county, degrees Fahrenheit _____________________
f. Education by level completed, e.g, did not finish high school, high school graduate, college graduate ____________________
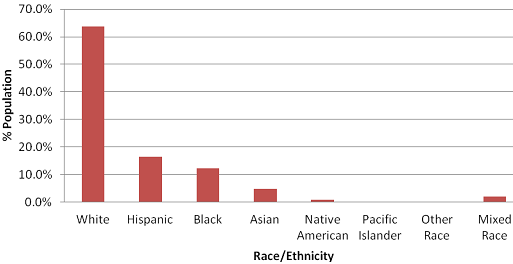
2. Below is a column chart for the U.S. population classified by race and ethnicity. What is the modal category? Put your answer here:
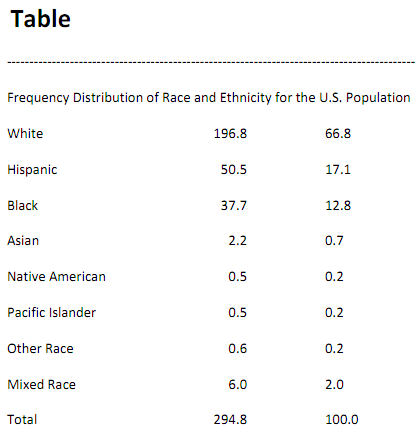
3. Below is a frequency table show the distribution of the U.S. population by race and ethnicity. Find five mistakes in the table. Write your answers on the table or in the space on the right.
4. To the left are descriptive statistics for the percent of the population living in urban areas across counties and county equivalents in the United States, including Puerto Rico. Use this data to answer the questions below and also in the next problem.
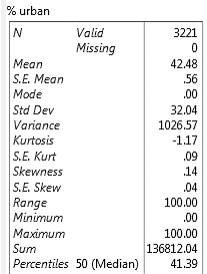
a. What is the unit of analysis? (Hint: It's not on the output.)
b. How many data points are in the analysis?
c. What numerical value represents the "average" % urban in this distribution?
d. What numerical value represents the "average error" for each data point from the "average"?
e. What numerical value represents the middle value in the distribution?
f. What is the numerical value for % urban for the place with the lowest rate?
g. What is the numerical value for % urban with the highest rate?
h. There is a statistic on the output that tells us whether the distribution wobbles to the left of the right. What is the numeric value of this statistic, and what do you conclude about the wobble in this case?
i. There is a statistic on the output that tells us whether the distribution is tall and skinny. What is the numeric value of this statistic, and what do you conclude about the shape of the distribution?
j. Base on h and i above, would you consider transforming this data, and why? (Assume that you do not have a picture of the data.)
k. What is the numerical value of the "average" of the sampling distribution?
l. What is the numerical value of the "average error" for each data point in the sampling distribution
5. To the right is a histogram for % urban data above? Answer the two questions below based on this picture.
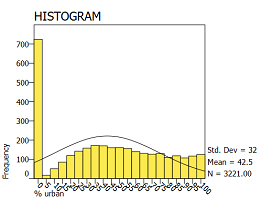
a. Describe the skew of this distribution.
b. How might one transform this distribution to make it similar to the normal distribution?