A member of the state legislature has expressed concern about the differences in the mathematics test scores of high school freshmen across the state. She asks her research assistant to conduct a study to investigate what factors could account for the differences. The research assistant looked at a random sample of school districts across the state and used the factors of percentage of mathematics teachers in each district with a degree in mathematics, the average age of mathematics teachers and the average salary of mathematics teachers
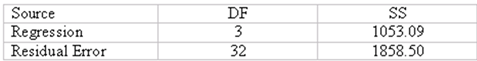
Analysis of Variance
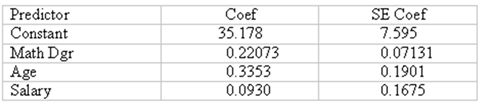
Write the least squares prediction equation. What is the number of observations in the sample? Based on the multiple regression model given above, estimate the mathematics test score and calculate the value of the residual, if the percentage of teachers with a mathematics degree is 50.0, the average age is 43 and the average salary is 48,300 (48.3). If the actual mathematics test score for these factors is 68.50, what is the error for this observation?
For the above equation answer the following: What is the total sum of squares? What is the explained variation? What is the mean square error?
For the above equation, calculate the Coefficient of Determination and the Adjusted coefficient of Determination and Test for the overall usefulness of the model using F-Statistic at 5% and 1% significance levels.
For the above Regression, test the usefulness (or significance of the three independent variables using t-test for 5% and 1% significance levels.