Assignment: Statistics in Educational Research
Chapter Seven
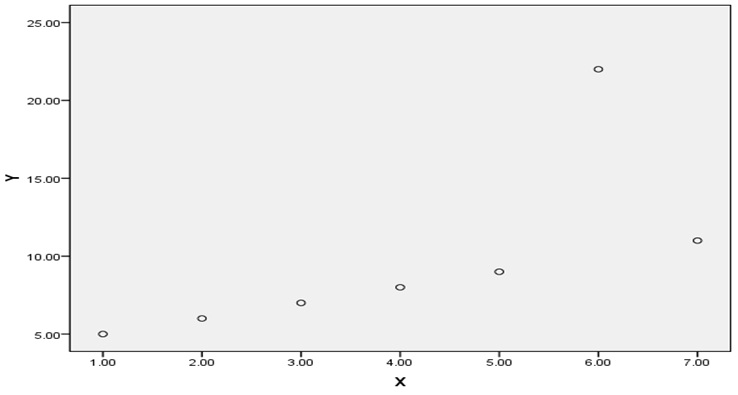
Problem 1) Look at the scatter plot below. Does it demonstrate a positive or negative correlation? Why?
Are there any outliers? What are they?
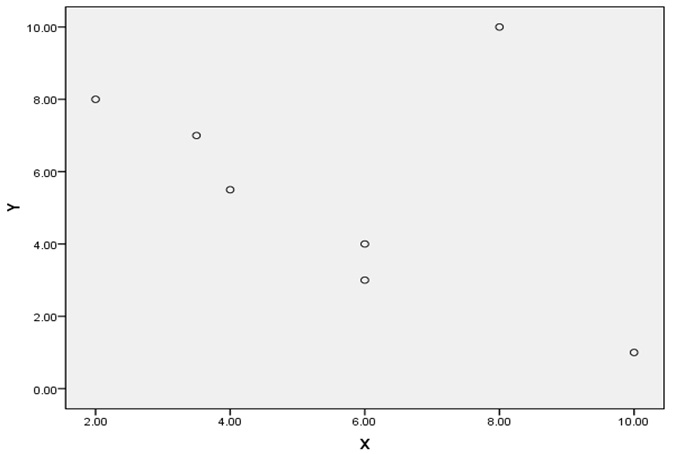
Problem 2) Look at the scatter plot below. Does it demonstrate a positive or negative correlation? Why?
Are there any outliers? What are they?
Problem 3) The following data come from your book, problem 26 on page 247. Here is the data:
Mean daily calories Infant Mortality Rate (per 1,000 births)
1523 154
3495 6
1941 114
2678 24
1610 107
3443 6
1640 153
3362 7
3429 44
2671 7
a) For the above data construct a scatter plot using SPSS or Excel (Follow instructions on page 244 of your textbook). What does the scatter plot show? Can you determine a type of relationship? Are there any outliers that you can see?
b) Using the same data conduct a correlation analysis using SPSS or Excel. What is the correlation coefficient? Is it a strong, moderate or weak correlation? Is the correlation significant or not? If it is what does that mean?
Problem 4)
Bill is doing a project for you in the marketing department. In conducting his analysis regarding consumer behavior and a new product that has come out, he tells you the correlation between these two variables is 1.09. What is your response to this analysis?
Problem 5)
Judy has conducted an analysis for her supervisor. The results she obtained was a correlation coefficient that was negative 0.86. Judy is confused by this number and feels that because it is negative and not positive, is means that it is bad. You are here supervisor. How would you clarify this result for Judy regarding the meaning of the correlation?
Problem 6)
Explain the statement, "correlation does not imply causality."
Problem 7)
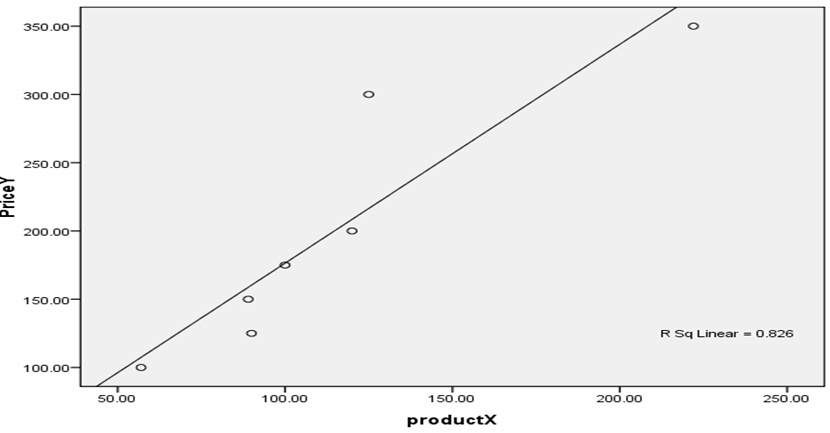
Using the best-fit line below for prediction, answer the following questions:
a) What would you predict the price of Product X in volume of 150 to be (approximately)?
b) What would you predict the price of Product X in volume of 100 to be (approximately)?
Problem 8)
You are interested in finding out if a student's ACT score is a good predictor of their final college grade point average (GPA). You have obtained the following data and are going to conduct a regression analysis. Follow instructions on page 244 of your textbook under line of best fit to conduct this analysis?
ACT GPA
22.0 3.0
32.0 3.78
33.0 3.68
21.0 2.94
27.0 3.38
25.0 3.21
30.0 3.65
a) What is the R? What type of relationship does it indicate (strong/weak; positive/negative)?
b) Go to the coefficients readout. The constant is the intercept. Under that is the ACT and that is the slope. Using the straight line formula of Y = mx + b, which you will find on page 262, you will now predict some future GPA scores: In the formula (m) is the slope; (x) is the variable that you are looking to use as a predictor; and (b) is the intercept. Predict GPA from the following ACT scores using the regression equation/straight line formula (show all your work):
1) 20
2) 25
3) 34
Chapter Eight
Problem 1)
A sample of nine students is selected from among the students taking a particular exam. The nine students were asked how much time they had spent studying for the exam and the responses (in hours) were as follows:
18, 7, 10, 13 12, 16, 5, 20, 21
Estimate the mean study time of all students taking the exam. Round your answer to the nearest tenth of an hour, if necessary.
Problem 2)
Scores on a particular test have a mean of 64.6. The distribution of sample means for samples of size 100 is normal with a mean of 64.6 and a standard deviation of 1.9. Suppose you take a sample of size 100 of test scores and find that the mean is 63. What is the z-score corresponding to this sample mean?
Problem 3)
There are 349 teachers at a college. Among a sample of 110 teachers from this college, 66 have doctorates. Based on this sample, estimate the number of teachers at this college without doctorates.
Problem 4)
Sample size = 400; sample mean = 44; sample standard deviation = 16. What is the margin of error?
Problem 5)
A sample of 64 statistics students at a small college had a mean mathematics ACT score of 28 with a standard deviation of 4. Estimate the mean mathematics ACT score for all statistics students at this college. Give the 95% confidence interval.
Problem 6)
A government survey conducted to estimate the mean price of houses in a metropolitan area is designed to have a margin of error of $10,000. Pilot studies suggest that the population standard deviation is $70,000. Estimate the minimum sample size needed to estimate the population mean with the stated accuracy.
Problem 7)
A researcher wishes to estimate the proportion of college students who cheat on exams. A poll of 490 college students showed that 33% of them had, or intended to, cheat on examinations. Find the margin of error for the 95% confidence interval.
Format your assignment according to the following formatting requirements:
1. The answer should be typed, double spaced, using Times New Roman font (size 12), with one-inch margins on all sides.
2. The response also include a cover page containing the title of the assignment, the student's name, the course title, and the date. The cover page is not included in the required page length.
3. Also Include a reference page. The Citations and references should follow APA format. The reference page is not included in the required page length.