Complete the following:
Q1. The following chart shows the selling price ($000) of houses sold in the Billings, Montana, area.
a. How many homes were studied?
b. What is the class interval?
c. One hundred homes sold for less than what amount?
d. About 75 percent of the homes sold for less than what amount?
e. Estimate the number of homes in the $150,000 up to $200,000 class.
f. About how many homes sold for less than $225,000?
Q2. The following data give the weekly amounts on groceries for a smaple of households
a. How many classes would you recommend?
b. What class interval would you suggest?
c. What would you recommend as the lower limit of the first class?
d.Organize the data into a frequency distribution,
Q3. (a) determine the median and (b) the mode.
The following are the ages of the 10 people in the video arcade at the Southwyck Shopping Mall at 10 A.M. this morning.
12 8 17 6 11 14 8 17 10 8
Q4. In 1996 a total of 14,968,000 taxpayers in the United States filed their individual tax returns electronically. By the year 2002 the number increased to 46,282,200. What is the geometric mean annual increase for the period?
Q5. Kevin Horn is the national sales manager for National Textbooks, Inc. He has a sales staff of 40 who visit college professors all over the United States. Each Saturday morning he requires his sales staff to send him a report. This report includes, among other things, the number of professors visited during the previous week. Listed below, ordered from smallest to largest, are the number of visits last week.

a. Determine the median number of calls.
b. Determine the first and third quartiles.
c. Determine the first decile and the ninth decile.
d. Determine the 33rd percentile.
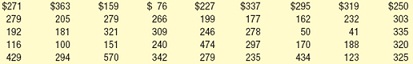
Q6. a. Determine the mean, median, and the standard deviation.
b. Determine the coefficient of skewness using Pearson's method.
c. Determine the coefficient of skewness using the software method.
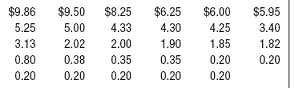
Listed below are the salaries for the New York Yankees for the year 2000. The salary information is reported in millions of dollars.
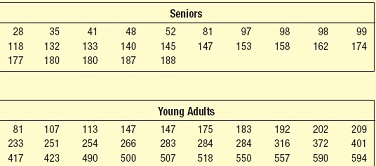
Q7. A study is made by the recording industry in the United States of the number of music CDs owned by senior citizens and young adults. The information is reported below.
a. Find the median and the first and third quartiles for the number of CDs owned by senior citizens. Develop a box plot for the information.
b. Find the median and the first and third quartiles for the number of CDs owned by young adults. Develop a box plot for the information.
c. Compare the number of CDs owned by the two groups.