Assignment:
Objectives
This lab has two main goals: to introduce the study of vector quantities and to present a simple exploration of Newton's third law. This lab would ask you to identify forces in a concrete setting and apply the third law to different situations.
Procedure
In this activity we will use Force Sensors attached to carts to measure the forces during their interactions in collisions and a "tug-of-war". Computer Setup
1. Connect the interface to the computer, turn on the interface, and turn on the computer.
2. Connect one Force Sensor DIN plug to Analog Channel A on the interface, and the other Force Sensor DIN plug to Analog Channel B.
3. Open the PASCO Capstone program.
4. Find, in the main hard drive of the computer, the file "Activity_Third_Law.cap". If not available, download it from blackboard. Open this file.
The sensors are calibrated so that the Force Sensor connected to Analog Channel B will react in the opposite way as the Force Sensor connected to Analog Channel A. For example, a pull will be a negative force for Sensor A and a pull will be a positive force for Sensor B.
Equipment Setup
1. Place the Dynamics Track on a horizontal surface. Level the Dynamics Track by placing the Dynamics Cart on the Dynamics Track. If the cart rolls one way or the other, use the Adjustable Feet at one end of the Dynamics Track to raise or lower that end until the Dynamics Track is level and the cart does not roll one way or the other.
2. If not already done, use the thumbscrew that comes with the Force Sensor to mount the sensor onto the accessory tray of each cart.
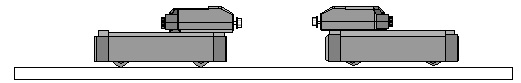
3. Place the carts on the track so that the hooks on the Force Sensors face each other.
4. If not already done, unscrew the hook attachments from the front of each of the Force Sensors. In their place, put the magnetic collision bumpers from the Accessory Bracket .
5. The system must look like the following figure.
Data Recording - Collision
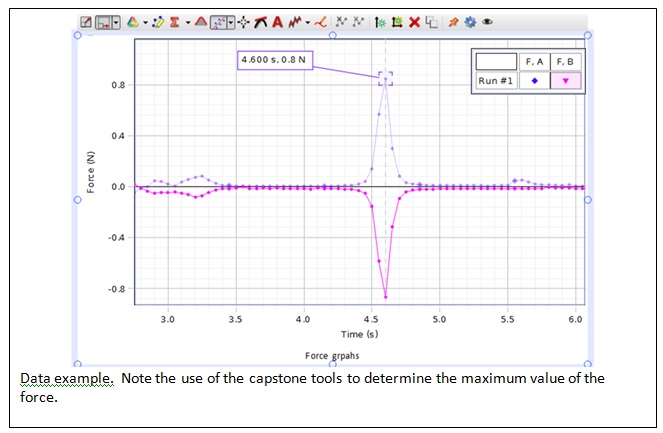
After each trial you must save a graph of the forces as a function of time and prepare annotations of the relevant features in those graphs.
1. Move the carts to opposite ends of the track. Push the tare button on each sensor to zero the sensor. Remember to repeat this operation before each trial.
2. Begin data recording, press the start button in your computer.
3. Push the two carts together, allowing them to collide at approximately equal speeds near the center of the track.
4. End data recording after the carts have collided. The data will appear as labeled "Run", and will identified by a number. Analyze your results using the procedure outlined below (Analyzing the data). Continue your procedure only after you are convinced that your data makes sense.
5. Add additional mass to one of the carts. Repeat the data recording procedure.
6. Repeat the data recording procedure again, but allow the lighter cart to remain stationary and push only the heavier cart.
7. Repeat the data recording procedure for two mass and velocity combinations. Describe each combination in the Lab Report section.
Data Recording - Tug-of-War
1. Remove one Force Sensor from a cart.
2. Mount the Force Sensor on the Accessory Bracket. Mount the Accessory Bracket in the T-slot on the side of the Dynamics Track. The Force Sensor should be at the same height as the Force Sensor that is still on the cart.
3. Remove the magnetic bumpers from the front of each of the Force Sensors. In their place, put the hooks.
4. Connect the two Force Sensors together with their hooks. Use a rubber band, piece of string, or piece of tape to connect the hooks together.
5. Push the tare button on each sensor to zero the sensor.
6. Begin data recording.
7. Push and pull the free cart back-and-forth and observe how the force readings for the two sensors change. End data recording.
Analyzing the Data - Collision
1. Compare the Force versus time measurements for both sensors. Describe the relation between the two of them.
2. Interpret the sign of the force measured. How is this sign related to the direction of the force on each of the carts?
3. What are the maximum values of the force? Compare these values to the weight of the cart.
4. Repeat this procedure for the other force vs. time plot and for each of the data runs. Can you establish a relation between the starting velocity of the carts and the magnitude of the force?
Analyzing the Data -Tug-of-War
1. Compare local maxima and minima for the force vs. time plots for the two Force Sensors.
2. Organize your observations in a excel table. Make sure to carefully label the run number along with your measurement. Repeat this procedure for two other areas (four other data points) on the force vs. time plots.
Notes
1. Are these quantities equal? In these experiments we will often make a prediction regarding the equality of two numbers. In practice, we will never observe the two measured quantities being identical. This does not mean that our experiment is incorrect. Rather, we make statements of the form: "the measured quantities satisfy our prediction of being equal to each other within an x% margin of error". For the purposes of this course, we expect our predictions to hold within a 10% margin.
Short Report
1. What forces act on the two carts as they interact during a collision?
2. What is Newton's third law prediction for the processes studied?
3. Which cart experiences more force when one of them starts the process at rest?
4. Which cart experiences more force when both carts are moving and have unequal masses?
5. What is the overall effect of the cart's velocity on the measured force, and on the relation between the pairs of forces studied?
6. What is the effect of the mass of the carts on the relation between the pairs of forces studied?
8. What sources of error can you identify in this experiment?
Attachment:- Graph-no mass.rar