Discuss the below:
Q: Consider the two Xbar charts shown below for two processes. The charts may OR may not have instances of special cause variation. Identify ALL violation(s) (if any) of the eight tests where statistical signals show that special cause variation is indeed occurring. State which test is violated (by number OR explanation) AND circle on the charts the sample involved in the violation. If the chart does not show signs of special cause, state that the process is good statistical control.
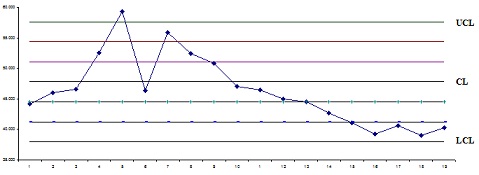
a. Conclusions for Xbar Chart: State which test is violated (by number OR explanation) AND circle on the charts the sample involved in the violation.
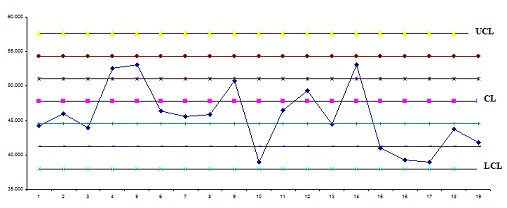
b. Conclusions for Xbar Chart: State which test is violated (by number OR explanation) AND circle on the charts the sample involved in the violation.