Solve the following:
Statistics Problem
1. Create a real-life research question or topic of your choosing. This question may be something that you work with in your career, see on a daily basis, come from a hobby, etc. The response to the question (your data) should be quantitative (numerical).
Solution:
The United States is experiencing high death rate due to cancer. The important factor for cancer is cigarettes. Nowadays, Cigarettes are smoked by even children. This interests us to know which of the states in U.S. are buying more cigarettes and to know on an average what would be the sales of cigarettes in total United States.
The data set is shown in Excel Sheet for your reference.
2. Choose a legitimate sampling strategy and collect at least 30 data points using your created question or topic. Discuss the sampling strategy in sufficient detail so that someone else could repeat your data collection without any difficulties or questions.
Solution:
To know about the cigarette sales, the data has been collected in every state of United States. In every state 30 shops has been selected and the sales of cigarettes per capita is collected. And average per capital sales for these 30 shops was found.
Sampling Strategy:
The sampling strategy here followed is Simple Random Sampling. In every state 30 shops are selected and per capita sales of cigarettes are collected. The data set is given in Excel Sheet.
The aim of the study is clear that most of the states in U.S. lie in which of the interval. A histogram will reveal the fact about the above. A histogram is given below for the data in Excel Sheet.
3. Prepare a histogram of your data.
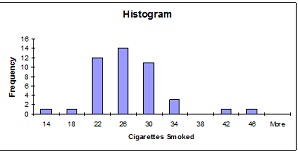
The intervals fixed for the histogram is shown below.
|
Cigarette Sales
|
Number of States
|
|
14 or Less
|
1
|
|
14 - 18
|
1
|
|
18 - 22
|
12
|
|
22 - 26
|
14
|
|
26 - 30
|
11
|
|
30 - 34
|
3
|
|
34 - 38
|
0
|
|
38 - 42
|
1
|
|
42 - 46
|
1
|
|
46 or More
|
0
|
So in the interval 22 - 26 there are more states. So we can conclude that on an average the cigarette sale among the states in United States is 14.
Further Research:
The research may be extended on this topic by collecting the number of deaths due to cancer in respective states and deaths due to various types of cancer.
Table:
The table given below gives the per capita cigarette sales in each state of United States.
|
States
|
Cigarette Sales
|
|
AL
|
18.2
|
|
AZ
|
25.82
|
|
AR
|
18.24
|
|
CA
|
28.6
|
|
CT
|
31.1
|
|
DE
|
33.6
|
|
DC
|
40.46
|
|
FL
|
28.27
|
|
ID
|
20.1
|
|
IL
|
27.91
|
|
IN
|
26.18
|
|
IO
|
22.12
|
|
KS
|
21.84
|
|
KY
|
23.44
|
|
LA
|
21.58
|
|
ME
|
28.92
|
|
MD
|
25.91
|
|
MA
|
26.92
|
|
MI
|
24.96
|
|
MN
|
22.06
|
|
MS
|
16.08
|
|
MO
|
27.56
|
|
MT
|
23.75
|
|
NB
|
23.32
|
|
NE
|
42.4
|
|
NJ
|
28.64
|
|
NM
|
21.16
|
|
NY
|
29.14
|
|
ND
|
19.96
|
|
OH
|
26.38
|
|
OK
|
23.44
|
|
PE
|
23.78
|
|
RI
|
29.18
|
|
SC
|
18.06
|
|
SD
|
20.94
|
|
TE
|
20.08
|
|
TX
|
22.57
|
|
UT
|
14
|
|
VT
|
25.89
|
|
WA
|
21.17
|
|
WI
|
21.25
|
|
WV
|
22.86
|
|
WY
|
22.04
|
|
AK
|
30.34
|
Using the above information (questions and answers)-answer the following questions.
4. Find the mean, median, mode, variance, and standard deviation.
6. Find the 95% confidence interval for the true population mean of your topic
Now consider your sample to be the actual population. Take a random sample of 10 data points from your population. Using this sample of 10, test the claim that the actual population mean is greater than X (i.e. µ > X). [The value for X will be different for everyone...here's how I want you to find it...add 6% to the mean that you found in question number 4 above, and let that be X. For example, if the mean in question 4 was 100, X would be 106...or 100(1.06)]. Test your claim using a significance level of 0.05. Note that you will be using the t-distribution since n = 10.