Assignment: Correlation
A researcher is interested in investigating the relationship between viewing time (in seconds) and ratings of aesthetic appreciation. Participants are asked to view a painting for as long as they like. Time (in seconds) is measured. After the viewing time, the researcher asks the participants to provide a ‘preference rating' for the painting on a scale ranging from 1-10. Create a scatter plot depicting the following data:
|
Viewing Time in Seconds
|
Preference Rating
|
|
10
|
3
|
|
12
|
4
|
|
24
|
7
|
|
5
|
3
|
|
16
|
6
|
|
3
|
4
|
|
11
|
4
|
|
5
|
2
|
|
21
|
8
|
|
23
|
9
|
|
9
|
5
|
|
3
|
3
|
|
17
|
5
|
|
14
|
6
|
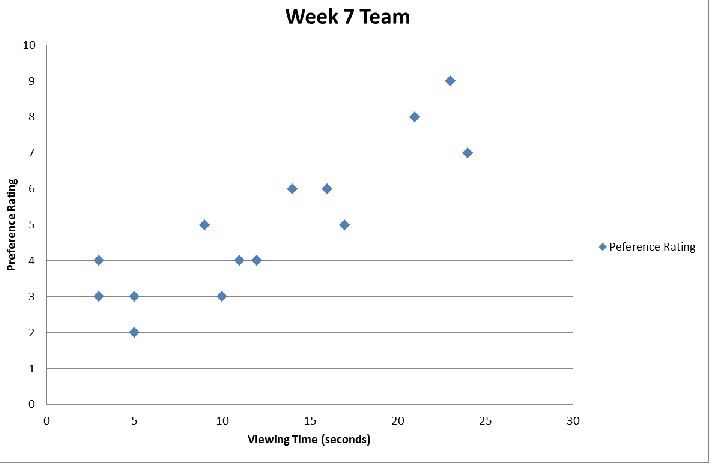
What does the scatter plot suggest about the relationship between viewing time and aesthetic preference?
The scatter plot suggests that there is a positive relationship between viewing time and aesthetic preference as the data goes upward when looking at it from left to right. Those that viewed the painting for a longer period of time seemed to have a greater preference rating.
Is it accurate to state that longer viewing times are the result of greater preference for paintings? Explain.
Format your assignment according to the following formatting requirements:
1. The answer should be typed, double spaced, using Times New Roman font (size 12), with one-inch margins on all sides.
2. The response also includes a cover page containing the title of the assignment, the student's name, the course title, and the date. The cover page is not included in the required page length.
3. Also include a reference page. The Citations and references should follow APA format. The reference page is not included in the required page length.