Discuss the below:
1.The normal annual precipitation (in inches) is given below for 5 different American cities.
12.2 9.9 10.3 13.3 16.9
Find the mean, median, and standard deviation for annual precipitation.
2. The probability that a person is immune to a certain disease is 0.40.
a. What is the probability that 4 people will have the disease in a sample of 12 people?
b. Find the mean number of people who have immunity in a sample of size 12.
c. Find the standard deviation for the same sample.
3. If the capacities of the cranial cavities of a certain population are approximately normally distributed with a mean of 1400 cc and a standard deviation of 125, find the probability that a randomly selected person from the given population will have a cranial cavity capacity greater than 1450 cc.
4. IQ scores are normally distributed with a mean of 100 and a standard deviation of 15. In a random sample of 50, approximately how many people will have IQ scores between 95 and 105?
5. Human body temperatures are normally distributed with a mean of 98.6°F and a standard deviation of 0.72°F. Find the temperature that separates the top 7% from the bottom 93%.
6. In a sample of 49 adolescents who served as the subjects in an immunologic study, one variable of interest was the diameter of skin test reaction to an antigen. The sample mean and sample standard deviation were 21 and 11 mm erythema, respectively. Can it be concluded from these data that the population mean is less than 30? Let a = 0.05. Assume that the population standard deviation is s = 12.2.
7. A test of abstract reasoning is given to a random sample of students before and after they completed a formal logic course. The results are given below. Construct a 95% confidence interval for the mean difference between the before and after scores. Is there evidence to suggest the logic course improves abstract reasoning? You may assume that the differences for the dependent samples are normally distributed.
Before 74 83 75 88 84 63 93 84 91 77
After 73 77 70 77 74 67 95 83 84 75
8. To examine the effect of pets in stressful situations, researchers recruited 45 women who said they were dog lovers. Fifteen of the subjects were randomly assigned to each of three groups to do a stressful task alone, with a good friend present, or with their dog present. (The stressful task was to count backwards by 13s or 17s.) The subject's mean heart rate during the task is one measure of the effect of stress. The Minitab ANOVA output for the data is given below.
Minitab -- One-way Analysis of Variance
Analysis of Variance for rate
Source DF SS MS F P
group 2 2387.7 1193.8 14.08 0.000
Error 42 3561.3 84.8
Total 44 5949.0
Individual 95% CIs For Mean
Based on Pooled StDev
Level N Mean StDev -----+---------+---------+---------+-
control 15 82.524 9.242 (-----*-----)
friend 15 91.325 8.341 (-----*-----)
pet 15 73.483 9.970 (-----*-----)
-----+---------+---------+---------+-
Pooled StDev = 9.208 72.0 80.0 88.0 96.0
a. Do the mean heart rates for the groups appear to show that the presence of a pet or a friend reduces heart rate during a stressful task?
b. What are the values of the ANOVA F-statistic and its p-value? What hypotheses does F test? Briefly describe the conclusions you draw from these data. Did you find anything surprising
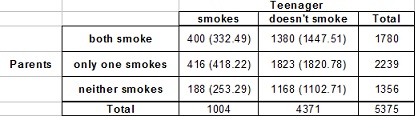
9. Are the smoking habits of teenagers related to their parents' smoking? Below are the results of a survey of teenagers in eight Arizona high schools. Expected values are in parentheses. Perform a hypothesis test to determine if the smoking habits of teenagers are independent of the smoking habits of their parents. Test at the 0.05 level of significance.
10. Archaeopteryx is an extinct beast having feathers like a bird but teeth and a long bony tail like a reptile. Five fossil specimens have preserved both the femur and humerus bones. The measurements (in centimeters) for each bone are given below.
Femur 38 56 59 64 74
Humerus 41 63 70 72 84
Scientists are interested in determining if there is a strong relationship between the lengths of the two bones so that they might be persuaded that the five specimens belong to the same species. The Minitab output for regression is provided below.
Minitab -- Regression
The regression equation is humerus = - 3.66 + 1.20*femur
Predictor Coef StDev T P
Constant -3.660 4.459 -0.82 0.472
femur 1.19690 0.07509 15.94 0.001
S = 1.982 R-Sq = 98.8% R-Sq(adj) = 98.4%
Analysis of Variance
Source DF SS MS F P
Regression 1 998.21 998.21 254.10 0.001
Residual Error 3 11.79 3.93
Total 4 1010.00
a. Make a scatterplot of the data with femur length as the predictor variable.
b. What is the slope of the regression equation?
c. What is the correlation coefficient, r?
d. Predict the length of a humerus for a fossil specimen with a femur that is 45 cm long.
e. Does the data suggest that the length of a femur and the length of a humerus are positively correlated? Test at the 0.01 level of significance. Be sure to explain your reasoning.