Discuss the following:
Q1: A travel agency is concerned with the accuracy and appearance of itineraries prepared for its clients. Defects can include errors in times, airlines, flight numbers, prices, car rental information, lodging, charge card numbers and reservation numbers, as well as typographical errors. As the possible number of errors is nearly infinite, the agency measures the number of errors that do occur.
The current process results in an average of three errors per itinerary.
A. What are the two-sigma control limits for these defects?
B. A client scheduled a trip to Dallas. Her itinerary contained six errors. Interpret this information.
Q2: As a hospital administrator of a large hospital, you are concerned with the absenteeism among nurses' aides. The issue has been raised by registered nurses, who feel they often have to perform work normally done by their aides. To get the facts, absenteeism data were gathered for the last two weeks, which is considered a representative period for future conditions. After taking random samples of 64 personnel files each day, the following data were produced:Because your assessment of absenteeism is likely to come under careful scrutiny, you would like a type I error of only 1 percent. You want to be sure to identify any instances of unusual absences. If some are present, you will have to explore them on behalf of the registered nurses.
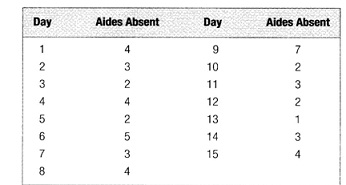
a. Design a p-chart.
b. Based on your p-chart and the data from the last 2 weeks, what can you conclude about the absen¬teeism of nurses' aides?
Q3:.A textile manufacturer wants to set up a control chart for irregularities (e.g., oil stains, shop soil, loose threads, and tears) per 100 square yards of carpet. The following data were collected from a sample of twenty 100-square-yard pieces of carpet.
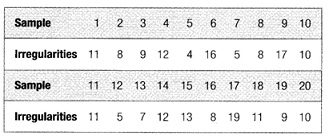
a. Using these data, set up a c-chart with z = 3.
b. Suppose that the next five samples had 15, 18, 12, 22, and 21 irregularities. What do you conclude?
Q4: The IRS is concerned with improving the accuracy of tax information given by its representatives over the telephone. Previous studies involved asking a set of 25 questions of a large number of IRS telephone repre-sentatives to determine the proportion of correct responses. Historically, the average proportion of cor-rect responses has been 70 percent. Recently, IRS rep-resentatives have been receiving more training. On April 1, the set of 25 tax questions were again asked of 20 randomly selected IRS telephone representatives. The proportions of correct answers were 0.88, 0.76,
0.64, 1.00, 0.76, 0.76, 0.72, 0.88, 0.50, 0.50, 0.40, 1.00,
0.88, 1.00, 0.64, 0.76, 0.76, 0.88, 0.40, and 0.76.
Interpretthe results of that study.