Assignment Task 1: Ocean Waves
Question 1: A jacket rig is to be designed and fixed to the sea bed. A buoy has recorded the following wave heights for the rig's operating field:
|
Wave Height (m)
|
0-2
|
02-Apr
|
04-Jun
|
06-Aug
|
08-Oct
|
|
Number of Waves
|
1040
|
1250
|
300
|
200
|
50
|
The drilling machinery is expected to be placed on the drill floor, which is located 5.5m above the mean sea level.
a) Use Rayleigh distribution to obtain the probability of the water reaching this level.
b) How will this probability change (based on Rayleigh distribution and the distribution defined by the data from the previous table if the machinery platform were to be placed at 4m above the sea level.
c) Plot the wave height histogram along with the theoretical Rayleigh Distribution
d) Calculate the significant wave height H(1/3), the H(1/10), and H(1/100) based on the wave elevation's data.
e) In your opinion, is it feasible to place the drill floor at 5.5m above the mean sea level'?
Question 2: The marine design consultancy where you work has been commissioned to design a new multi-purpose vessel for operation in open ocean conditions at the North Atlantic Ocean.
a) What possible sources would be available for identifying the wave environment that the new vessel will encounter during operations'? Provide advantages and disadvantages of each one.
b) What idealized wave spectrum would you use and why'?
c) Using the Pierson-Markowitz spectrum formulation, plot a seaway spectral density considering a significant wave height as per the table below. Select the significant wave height considering a 50-Year Return Period. Justify your decision.
Cell 110 56.75'N
Significant Wave Height Extremes oy Return Period
57 5 W Jan Feb Mar Apr May Jun Jul Aug Sep Oct Nov Dec Annual
10 Year 10 3 10.1 9.5 7 8 6 2 S. 3 4 3 5 7.7 9 4 10 7 10.9 11.6
25 Year 11.5 11.6 10.8 8.9 7.2 6.1 4.9 5.7 9 10.7 12.3 12 12.3
Z 50 Year 12 4 12 8 11 8 g 7 7 9 6 6 5 4 6 3 10 11 7 13 4 12 9 12 g
100 Yr. 13.3 13.9 12.B 10.5 8 6 7.2 5.8 6.8 1 0.9 12 7 14.6 13.7 13.5
d) Determine the wave amplitude for each circular wave frequencies in the spectral density curve
e) Calculate ¯Tz, ¯Tp and ¯λw
f) Calculate the bandwidth parameter e and explain the results
Question 3: Why do you think a submarine would go deep into the ocean during a storm?
Assignment Task 2:
Objective: Prepare a shipbuilding cost estimate for the following new construction ship:
Ship type: Product tanker
Deadweight: 35,000 tons
Light ship weight: 14,000
tons Gross tonnage: 25,000 gt
Weight breakdown by SWBS group:
|
Group
|
Title
|
Weight (tons)
|
|
100
|
Structure
|
9,000
|
|
200
|
Propulsion Machinery
|
1,000
|
|
300
|
Electrical
|
300
|
|
400
|
Command & Surveillance
|
25
|
|
500
|
Auxiliary Machinery
|
2,000
|
|
600
|
Outfit
|
1,675
|
Engineering hours (group 800) = 25% of the sum of group 100 to 600 hours Support Services hours (group 900) = 50% of the sum of group 100 to 600 hours
Your estimate deliverable will have seven sections:
1. Direct labor rate: specify and explain.
2. Overhead rate: specify and explain.
3. Levels of management reserve and profit: specify and explain.
4. A well-documented Excel spreadsheet to estimate the shipyard's cost to design and build the ship and the bid price.
5. A cross check. That is, check your results using different (simpler) approaches and/or different information sources.
6. How competitive do you expect your bid will be?
7. What action(s) do you recommend to increase your competitiveness and/or profit?
Assignment Task 3:
Problem 1:
Table 1 shows the fatigue test data, AISI 1045 steel.
a) Use linear regression to estimate the best fit to the data in log-log scale. Show the line on the same graph with the data.
b) Sketch upper and lower bounds for the data and comment on the observed scatter. Estimate the fatigue limit for the material and the fatigue strength at lx105 cycles to failure. Estimate the expected fatigue life at the stress amplitude of 175 MPa.
|
Stress amplitude sa
|
Fatigue life Nit
|
Note
|
|
130
|
10 000 000
|
|
|
130
|
1 750 000
|
|
|
130
|
1 600 000
|
|
|
130
|
2 330 000
|
|
|
130
|
10 000 000
|
|
|
150
|
1 860 000
|
|
|
150
|
1 100 000
|
|
|
150
|
601 300
|
|
|
150
|
485 000
|
|
|
170
|
190 567
|
|
|
170
|
465 000
|
|
|
170
|
153 140
|
|
|
170
|
311 250
|
|
|
185
|
144 430
|
|
|
185
|
152 060
|
|
|
185
|
176 960
|
|
|
185
|
116 430
|
|
|
220
|
46 240
|
|
|
220
|
52 020
|
|
|
220
|
62 500
|
|
|
220
|
95 000
|
|
|
220
|
65 300
|
|
|
245
|
30 100
|
|
|
245
|
38 500
|
|
|
245
|
26 300
|
|
|
245
|
29 600
|
|
Problem 2:
An un-notched member fabricated from AISI 4142 steel (see table) is subjected to the load history shown below.
a) Perform a rain flow count of the load history.
b) Estimate the number of cycles and the number of (blocks) repetitions to failure. Use the Goodman mean stress correction equation.
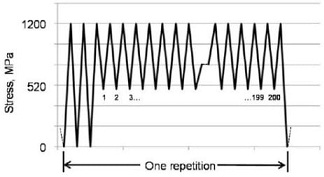
Figure: Load history for one repetition.
Table 2: Constraints for stress-life curves: tests at zero mean stress on unnotched axial specimen.
|
Material
|
Yield
|
Ultimate
|
True Fracture
|
σa = σ'f (2Nf )b
|
#NAME?
|
|
Strength
|
Strength
|
Strength
|
|
|
|
|
σn
|
σu
|
σfB
|
σ2f
|
A
|
b = B
|
|
(a) Steels
|
|
|
|
|
|
|
|
AISI 1015
|
227
|
415
|
725
|
976
|
886
|
-0.14
|
|
(normalized)
|
-33
|
-60.2
|
-105
|
-142
|
-128
|
|
|
Man-Ten
|
322
|
557
|
990
|
1089
|
1006
|
-0.115
|
|
(hot rolled)
|
-46.7
|
-80.8
|
-144
|
-158
|
-146
|
|
|
RQC-100
|
683
|
758
|
1186
|
938
|
897
|
-0.0648
|
|
(roller Q & T)
|
-99
|
-110
|
-172
|
-136
|
-131
|
|
|
AIS1 4142
|
1584
|
1757
|
1998
|
1937
|
1837
|
-0.0762
|
|
(Q & T, 450 HB)
|
-230
|
-255
|
-290
|
-281
|
-266
|
|
|
AISI 4340
|
1103
|
1172
|
1634
|
1758
|
1643
|
-0.0977
|
|
(aircraft quality)
|
-160
|
-170
|
-237
|
-255
|
-238
|
|
Avail The Top-Class Ocean Waves Assignment Help Service With 24x7 Support For Excelling Your Academic Grades And Performance With Ease!!
Tags: Ocean Waves Assignment Help, Ocean Waves Homework Help, Ocean Waves Coursework, Ocean Waves Solved Assignments, Rayleigh Distribution Assignment Help, Rayleigh Distribution Homework Help, Pierson-Markowitz spectrum Assignment Help, Pierson-Markowitz spectrum Homework Help, Goodman Mean Stress Correction Equation Assignment Help, Goodman Mean Stress Correction Equation Homework Help