Part 1: Open SimplePlotting.m and Matlab_Summary_Notes:
i) Use Matlab Summary to understand the meaning of lines 1 thru 10 in SimplePlotting.m.
ii) Using Matlab summary, explain the purpose of the " . " characters on line 12.
Write your summary here.
Run - SimplePlotting.m and answer the following questions:
i) What is the peak value of y on the second graph:
ii) At what time does the peak value of y appear on the second graph:
Open tf_demo.m and Matlab_Summary_Notes:
f) Use Matlab Summary to attempt to understand the entire program (tf_demo.m)
Run - tf_demo.m and answer the following questions:
i) What is the peak value of the impulse response (second graph):
ii) At what time does the peak value of the impulse response occur:
Part 2: Modify SimplePlotting.m to do the following:
i) Plot e-xsin2(x) from x=0 to x=6 pi, using 500 points, titles and labels
ii) Plot e-x cos2(2x) from x=0 to x=6 pi, using 500 points, titles and labels
iii) Plot both on the same graph, using titles, labels and a legend
Paste your Matlab script and your plots for problem-2 here!
Part 3: Modify tf_demo.m to do the following:
i) Use the tf() function to define a system variable for: x·¨ + 4x¨+ 6x·+ 8x = f(t)
Use the step() function to plot the response of the system for f (t) = u(t) (a unit step).
Paste your Matlab script and your plot for problem-3 here!
Part 4: Modify InverseLaplace.m to do the following:
i) Use ilaplace to determine the inverse laplace transform for: 2s +1/((s)(3s2 + 4s + 20))
Paste your Matlab script and results for problem-4 here!
Part 5: Modify - SecondOrder ODE.m to do the following:
i) Use the ode45() function to plot the solution for: x·¨ + 4x¨+ 6x·+ 8x = f(t) where f (t) = u(t) (a unit step) over the range 0 to 10 seconds. All initial conditions are zero. Plot the position and velocity on separate graphs
Paste your Matlab script and your plot for problem-4 here!
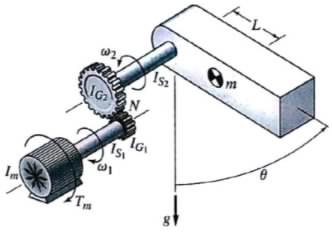
Part 6: The linearized equation of motion for a motor driven, geared pendulum is:
(0.23 + 0.5 m L2)θ¨ = Tm - c θ. - 4.9 mLθ
In this equation, the unknown is θ
The input is Tm, the motor torque.
The values of the constant parameters are:
m = 20, L = 0.5 and c = 8.0
Required:
i) Use Matlab and ode45() to solve the equation for the response to a constant motor torque, Tm = 10. The initial conditions are: θ = 1 and θ. = -2. Run the simulation for 4.0 seconds.
ii) Plot θ as a function of time. Be sure to use a title and meaningful plot labels.
iii) On a separate graph, plot θ. as a function of time. Be sure to use a title and meaningful plot labels.
Paste your Matlab script and your plots for problem-6 here!
For problems 7 and 8, set all initial conditions to a value of zero. The constant motor torque is Tm = 10.
Part 7: For the system given in problem 6, the analytical solution for θ(t) is claimed to be:
θ(t) = 0.7( 1 - e-1.1t sin(5t) )
Plot on the same graph the ode45() solution for θ (as computed in problem 6) along with this claimed analytical solution, for the purpose of comparing the Matlab solution to this claimed analytical solution. Be sure to use meaningful title and plot labels. Use legends to identify each curve. Comment on how well the analytical solutions matches the Matlab solution.
Paste your Matlab script and your plots for problem-7 here!
Part 8: For the linear system given in problem 6, c is the damping factor. Perform a parameter study on the effect of the damping factor, using values:
c = 1.0, c = 2.0, c = 4.0
Plot the ode45() solutions for θ vs time for the 3 different damping values, all on one plot, nicely labeled, with a title and a legend entry to identify each curve.
Paste your Matlab script and your plots for problem-8 here!
Part 9: The transfer function for the current in an Armature-Controlled DC motor is:
I(s)/V(s) = 9 × 10⁻⁵ s + 10-4/(18 × 10-8 s2 + 4.52 × 10⁻⁵ s + 2.55 × 10⁻³)
Use the Matlab tf() function to plot the response of this system to a step input of V(s) = 10.