Assignment:
1. [Reading] For this question, you are asked to read PART OF the article, “Agency Problems in Early Chartered Companies: The Case of the Hudson’s Bay Company”.
No sample answer for Question 1. (Refer to the sample answer for Assignment 1 if you need help understanding how to write a 3-2-1 report.)
2. [‘Raphing] The authors of ‘Indians, the Beaver, and the Bay’ …
a. Create a scatter plot for the Table 2 data, with Beaver Skins on the horizontal axis and Marten Skins on the vertical axis. (If doing the graph by hand, use the shorter, 4-year table. If doing the graph with Excel, use the full year-by-year table.) Your graph should have appropriate axis and main titles.
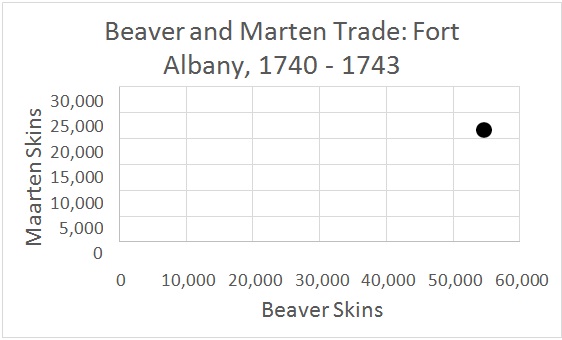
If you’re doing the graph by hand, you should label the axes, title the graph, and use the smaller data set to create a graph with a total of six points. I’ve done one of the points for you, below.
Years Beaver Skins Marten Skins
1740 - 1743 54,415 24,206
This point has (X,Y) = (54,41 , 24,206).
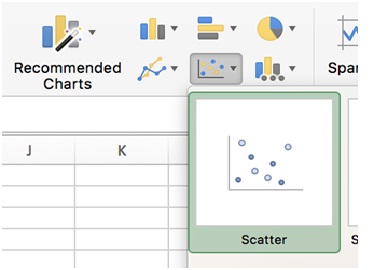
Excel: By now, you should know the basics of creating and editing a graph in Excel. If not, please refer to earlier sample answers. The only difference is that we’re going to be doing an X-Y (Scatter) diagram.
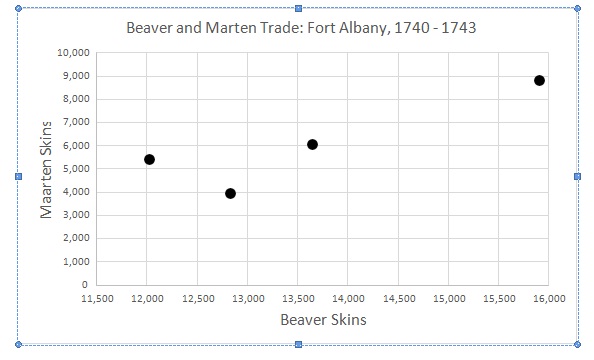
The first four years of data (1740 – 1743) are plotted below in the expected format. For your own answer, you should of course use the full series, 1740 – 1763.
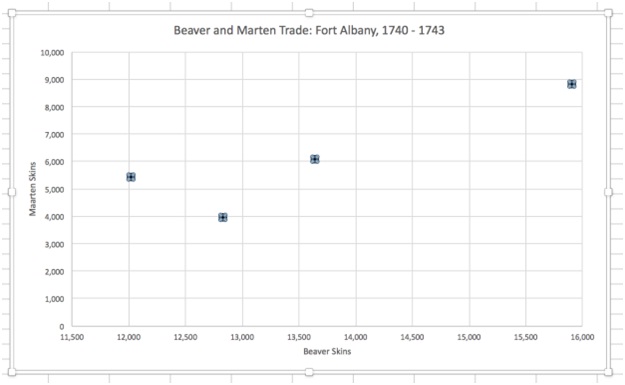
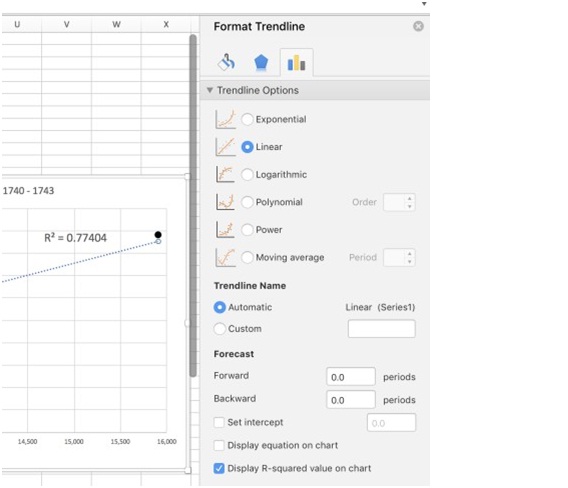
You are NOT required to insert a trendline or inspect the R2 of its fit, but should you wish to do so for fun (and to check both my math and the paper’s), this is how you do it:
i. Click once on the ‘dots’, so that all of them are selected:
ii. Right-click and select, ‘Add Trendline’.

iii. In the menu that pops up, select ‘Linear’ and ‘Display R2 on Chart’. That’s it!
b. Is your graph consistent with a fall in the beaver population? Is it possible that the marten population increased, instead? Explain briefly.
(Note: For full marks it is NOT enough to point out that there is no strong correlation between the two series – you need to be able to argue for or against a fall in the beaver population) .
3. [Research] This question will teach you how to use archival searches in order to fact-check published articles. Unlike previous assignments, most of the records you’ll look up are NOT available online, so you are only responsible for finding the appropriate data set’s catalog number unless told otherwise.
For this sample question, we’ll be looking up a map hosted digitally at the UVic library, which is allegedly from the Hudson Bay Company Archives: https://contentdm.library.uvic.ca/cdm/singleitem/collection/collection19/id/114
It’s a “Map of southern tip of Vancouver Island and Oregon Territory showing boundary line between possessions of Great Britain and United States: "Traced from a Map drawn under the order of the Senate of the United States at Washington 1848 (J. Arrowsmith)"
First, we head over to the Hudson’s Bay Company Archives Online Finding Aids:
https://www.gov.mb.ca/cgi- bin/print_hit_bold.pl/chc/archives/hbca/resource/index.html
In this sample answer, we’re looking for a map. That’s a ‘cartographic record’, so we click on the appropriate link. (For the actual assignment, you should first look in ‘Post Records’, which has records from trading posts.)

on the next page, we confirm that we want to start searching the maps (cartographic records):

We’re given a list of maps, so we search for something fitting our description:
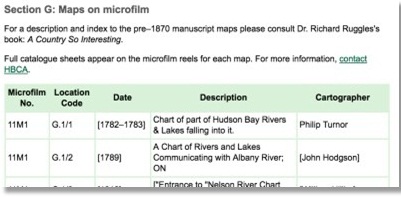
Searching for either ‘Oregon’ or ‘Arrowsmith’ quickly finds the map:

The number for our answer, in this case, would be ‘11M2’. It wouldn’t hurt to add the location number, G.1/156, since in this case ‘11M2’ refers to a microfilm containing a large number of maps.
As to why we chose this record, for the map in the sample answer, the answer is trivial: the record matches the author, date and description of the UBC holding (and is the only record listed to match all three).
References:
Question:1
Ann M. Carlos and Stephen Nichols, “Agency Problems in Early Chartered Companies: The Case of the Hudson’s Bay Company,” The Journal of Economic History, Vol. 50, No. 4, 1990, pp. 853 – 875.
Available with a UVic connection or VPN at https://www.jstor.org/stable/2122458
Financial Times, “Definition of principal/agent problem,” Financial Times Lexicon, https://lexicon.ft.com/term?term=principal/agent-problem
Question 2
Ann M. Carlos and Frank D. Lewis, “Indians, the Beaver, and the Bay: the Economics of Depletion in the Lands of the Hudson’s Bay Company, 1700 – 1763,” The Journal of Economic History, Vol. 53, No. 3, 1993, pp. 465 – 494.
Available with a UVic connection or VPN at https://www.jstor.org/stable/2122402
MathBits, “Correlation Coefficient,” https://mathbits.com/MathBits/TISection/Statistics2/correlation.htm
Question 3
Ann M. Carlos and Frank D. Lewis, “Indians, the Beaver, and the Bay: the Economics of Depletion in the Lands of the Hudson’s Bay Company, 1700 – 1763,” The Journal of Economic History, Vol. 53, No. 3, 1993, pp. 465 – 494.
Available with a UVic connection or VPN at https://www.jstor.org/stable/2122402
Online Finding Aids, Hudson’s Bay Company Archives: https://www.gov.mb.ca/cgi- bin/print_hit_bold.pl/chc/archives/hbca/resource/index.html
Document Reference Number information (from
above): https://www.gov.mb.ca/cgi- bin/print_hit_bold.pl/chc/archives/hbca/resource/post_rec/help.html#reel
Archives of Manitoba, Keystone Search: https://pam.minisisinc.com/pam/search.htm