Question:
Systems of Equations and interpretation of graphical data
The bar graph shows the percentage of Americans who used cigarettes, by ethnicity, in 1985 and 2002. For each of the groupsshown, cigarette use has been linearly decreasing. Use this information to solve exercise 72.
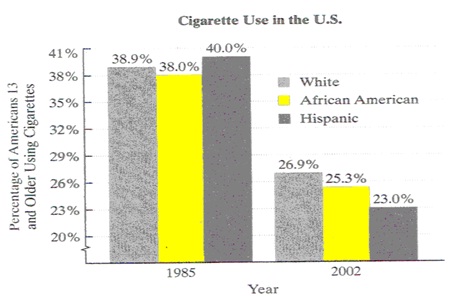
1. In this exercise, let x represent the number of years after 1985 and let y represent the percentage of Americans in one of the groups shown who used cigarettes.
a. Use the data points (0,38.9) and (17, 26.9)to finde the slope -intercept equation of the line that models the percentage of whites who used cigarettes, y, x years after 1985. Round the value of m to two decimal places.
b. Use the data points (0, 40) and (17, 23) to find the slope intercept equation of the line that models the percentage of Hispanics who used cigarettes, y, x years after 1985.
c. Use the models from parts (a0 and (b) to find the year, to the nearest whole year,during which cigarette use was the same for whites and Hispanics. What percentage of each group, to the nearest percent, used cigarettes during that year?
Use a system of linear equations to solve exercises. The graph shows the calories in some favorite fast foods. Use the information in the exercises to find the exact caloric content of the specified foods.
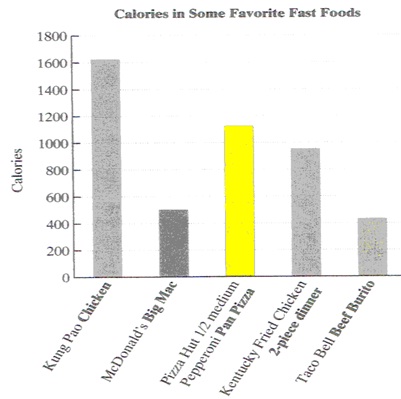
2) One Kung Pao chicken and two Big Macs provide 2620 calories. Two Kung Pao chickens and one Big Mac provide 3740 calories. Find the caloric content of each item.
3) Two medium eggs and three cups of ice cream contain 701 milligrams of cholesterol. One medium egg and one cup of ice cream exceed the suggested daily cholesterol intake of 300 milligrams by 25 milligrams. Determine the cholesterol content in each item.
4) A new restaurant is to contain two-seat tables and four-seat tables. Fire codes limit the restaurant's maximum occupancy to 56 customers. If the owners have hired enough servers to handle 17 tables of customers, how many of each kind of table should they purchase?