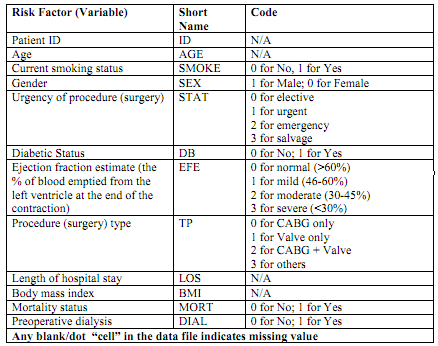
Data Description: Consider a study that was conducted to investigate the risk factors for mortality in cardiac surgery patients. Data was collected on Cardiac Surgery patients in public hospitals in St Martine Island from 2005 to 2011. The risk factors for 30-day mortality (patients died within 30-day of cardiac surgery) along with short name and their numerical codes (where necessary) are shown in Table
o 30-day mortality (MORT): patients who die within 30 days of cardiac surgery.
o Ejection fraction: the % of blood the left ventricular pump off in each beat of heart.
Question 1: Summarize the descriptive statistics for each of the variables listed in Table 1 by mortality status and discuss the results. Note: Please do not copy and paste the SPSS output; must summarize all the results in a single table in created in WORD (Hint: present list of variables in Column 1 and summary statistics in subsequent columns).
Question 2: Let us consider that a variable Y is heavily right skewed in the population. If you draw a large sample from this population what should be the shape of this variable (Y) in the sample? Justify your answer.
Question 3: Consider that weight of tumor of bladder cancer patients in the population follows normal distribution with a mean 50g and standard deviation 5g.
a) If a bladder cancer patient is selected randomly what is the probability that the tumor is less than 45g?
b) If 4 of these patients are selected at random, calculate the probability that the average weight of the 4 tumors (assume each patient has only one tumor) will be greater than 55g?
Question 4 : Juan makes a measurement in a chemistry laboratory and records the result in his lab report. The standard deviation of the students' lab measurement is 10 milligrams. Juan repeats the measurement 4 times and records the mean of his 4 measurements.
a) What is the standard deviation of Juan's mean result?
b) How many times must Juan repeat the measurement to reduce the standard deviation of the sample mean to 2?
Question 5 Suppose that in fact the blood cholesterol level of all men aged 20 to 30 is symmetric and bell shaped with mean 186 mg/dl and an unknown standard deviation.
a) Choose a simple random sample of 100 men from this population. The sample standard deviation is 41 mg/dl.
1) What is the probability that the sample mean takes a value between 183 and 189 mg/dl?
2) What is the probability that the sample mean takes a value less than 191 mg/dl?
b) Choose a simple random sample of 1000 men from this population. Now what is the probability that the sample mean falls within ±3 mg/dl of the population mean?
Question 6: The age group to which Anne belongs has mean height 1.6 metre and standard deviation 0.1 metre. The age group to which Devi belongs has mean height 1.2 metre and standard deviation 0.08 metre. Anne is 1.7 metre tall. Devi is 1.36 metre tall. Which is the taller for their age?
Question 7: Find the true answer(s) for the following questions
(A) It is necessary to estimate the mean blood sugar level by drawing a sample from a large population of diabetic patients. The accuracy of the estimate will depend on:
a. The mean sugar level in the population;
b. The population size;
c. The sample size;
d. The way the sample is selected;
e. The variance of sugar level in the population.
(B) The prevalence of a condition in a population is 0.1. If the prevalence is estimated
repeatedly from samples of size 10, these estimates will form a distribution which:
a. Is a sampling distribution;
b. Is approximately normal;
c. Has mean 0.1;
d. Have variance 0.001;
e. None of the above is true.
(C) If the size of a random sample is increased, we would expect:
a. The mean to decrease;
b. The standard error of the mean to decrease;
c. The standard deviation to decrease;
d. The sample variance to increase;
e. The mean to increase.
(D) The standard error of the mean of a sample:
a. Measures the variability of the observations;
b. Is the accuracy with which each observation is measured;
c. Is a measure of how far the sample mean is likely to be from the population mean;
d. Is a measure of how far the sample observations to be from the population mean;
e. Is less than the estimated standard deviation of the population.
(E) Diastolic blood pressure has a distribution which is slightly skew to the right. If the mean and standard deviation were calculated for the diastolic blood pressures of a random sample of men:
a. There would be fewer observations below the mean than above it;
b. The standard deviation would be approximately equal to the mean;
c. The majority of the observations would be more than one standard deviation from the mean;
d. The standard deviation would estimate the accuracy of blood pressure measurement;
e. About 95% of observations would be expected to be within two standard deviations of the mean.