Biaxial Curve Fitting
Reproduce the biaxial plots with Power, Voce, and Exp by using "ncf.exe".
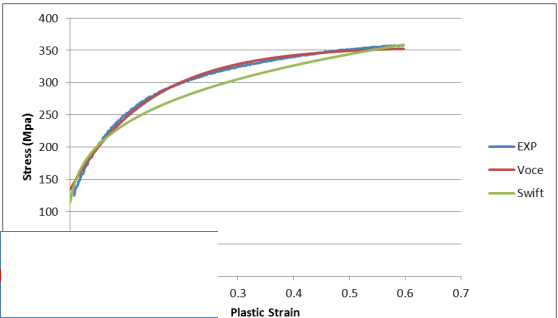
Use Platform-1.xls
Problem 1
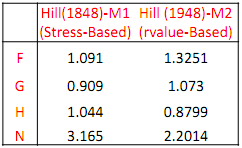
F,G,H,N calibrated from stress-ratios and r-values are given as follows :
Problem 2
Submit yield surface, stress-ratio and r-value plots including EXP, von Mises, Hill (1948)-M1, and Hill (1948)-M2 by using Platform-2.xlsx and discuss your results
Problem 3
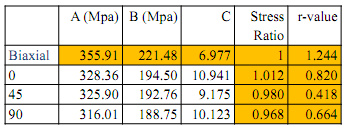
The following table for AA6022-T4E32 has been obtained from experiment
(1) Yld2000
(2) Yld89 Stress Based
(3) Yld89 r-value Based
(4) Hill (1948) Stress Based
(5) Hill (1948) r-value Based
Now you will be able to model anisotropy, yield function, and formability curves with the following options through "aniso.exe"(the manual for this code is attached).
Procedure :
1) Prepare the input files (yld-inp.txt and fld-inp.txt) using the provided table.
2) Run "aniso.exe" for the options 1,3,4
3) Prepare the following output data :
* yld-ten2d.txt : Yld2000-yld-ten2d.txt, Yld89-yld-ten2d.txt, Hill-yld-ten2d.txt
* yld-loc2d.txt : Yld2000-yld-loc2d.txt, Yld89-yld-ten2d.txt, Hill-yld-loc2d.txt
* fld-curve.txt : Yld2000-fld-curve.txt, Yld89-fld-curve.txt, Hill-fld-curve.txt
4) Plot the following (See the appendix for the examples with the labels) :
- Stress ratio plot for three options (make one plot) with EXPERIMENTAL DATA
- r-value plot for three options (make one plot) with EXPERIMENTAL DATA
- Outside yield surface for three options (make one plot) with EXPERIMENTAL DATA
- Strain-based forming limit for three options (make one plot)
5) Discuss the results for each plot