Question 1: The average prices for a product in 12 stores in a city are shown below:
$1.99, $1.85, $1.25, $2.55, $2.00, $1.99, $1.76, $2.50, $2.20, $1.85, $2.75, $2.85
Test the hypothesis that the average price is higher than $1.87. Use level of significance α = 0.05.
Question 2: A store wants to predict net profit as a function of sales for next year. Historical data for 8 years is illustrated in the table below.
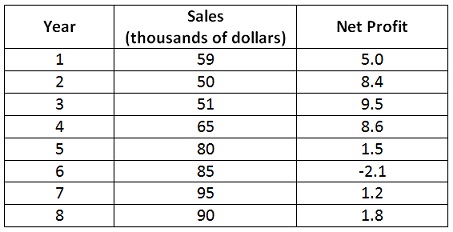
a) Make a scatter diagram for the data, by using Sales for the independent variable and Net Profit for the dependent variable. Insert the trend line and add the equation and R2 value to the diagram.
b) Find out the correlation coefficient. Comment on the value of the correlation coefficient.
c) Find out the predicted value of Y given X = 75. Give an interpretation of the predicted value in the context of the problem.
d) Make an ANOVA table and attach the summary output.
Question 3: Last week’s sales of a product at a retail store are shown in the given table:
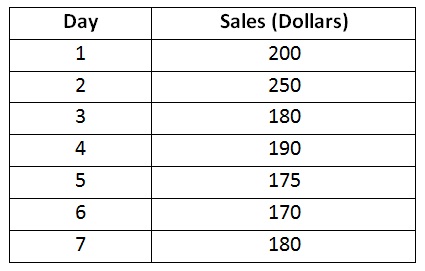
a) Use the 3-day moving average method for forecasting days 4-7.
b) Use the 3-day weighted moving average method for forecasting days 4-7. Use Weight 1 day ago = 4, Weight 2 days ago = 3 and Weight 3 days ago = 2.
c) Compare the methods by using the Mean Absolute Deviation.
Question 4: The revenue and cost functions for producing and selling quantity x for a certain company are described below.
R(x) = 12x – x2
C(x) = 21 + 2x
a) Find out the profit function P(x).
b) Calculate the break-even quantities.
c) Find out the average cost at the break-even quantities.
d) Find out the marginal revenue R’(x).
e) Find out the marginal cost C’(x).
f) At what quantity is the profit maximized?
Question 5: A company manufactures two products, Product A and Product B. The wholesale price and manufacturing cost of each product are illustrated below.
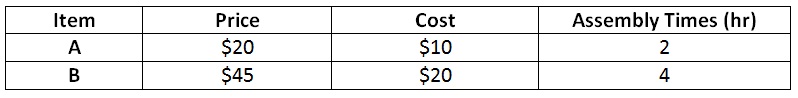
The company will generate a minimum of 10,000 of each item. Given the number of hours, the company can sell no more than 18,000 of Item A and 20,000 of Item B. Assume the company has 100,000 hours of assembly time available, how many of each item must it produce in order to maximize profits while meeting all essential constraints? Give the LP Model and use both the graphical method and Excel to find out the optimal solution.
Question 6: A company purchases its merchandise for $10 and sells for each item for $20. The pay-off table for the problem is given below.
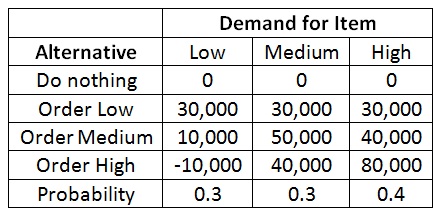
What is the decision based on each of the given criteria? Show work in making the decision for each criterion.
a) EMV approach.
b) EOL approach.