PSY 335 Assessment and Testing Assignment- Southern New Hampshire University
Interpreting Statistics Worksheet
In order for psychologists to conduct effective assessments, they must interpret test data. This assignment provides you an opportunity to analyze two sets of data and practice interpreting them. This assignment is intended as a review of descriptive statistics and correlation-a refresher to set the stage for understanding how these concepts will be applied in future modules, to understand what the scores represent, and to be able to summarize the data in a meaningful way.
Prompt: The included data set contains two sets of data-Verbal IQ test scores and Reading test scores, along with descriptive statistics for each variable and correlation data comparing the two variables. Please answer the following questions in the space provided in the Interpreting Statistics Worksheet.
In the Interpreting Statistics Worksheet, the following critical elements, specifically, must be addressed:
Testing of 20 randomly selected subjects yielded two sets of scores: Verbal IQ and Reading Comprehension. The table below displays the results and descriptive statistics, as well as frequency distribution charts for each variable and a scatterplot of the correlations between the two variables:
|
Subject
|
Verbal IQ
|
Rdg. Comp.
|
|
1
|
90
|
88
|
|
2
|
99
|
97
|
|
3
|
101
|
110
|
|
4
|
115
|
121
|
|
5
|
97
|
98
|
|
6
|
98
|
95
|
|
7
|
92
|
89
|
|
8
|
104
|
109
|
|
9
|
103
|
100
|
|
10
|
117
|
100
|
|
11
|
100
|
96
|
|
12
|
98
|
101
|
|
13
|
96
|
105
|
|
14
|
105
|
105
|
|
15
|
78
|
80
|
|
16
|
121
|
99
|
|
17
|
82
|
75
|
|
18
|
85
|
89
|
|
19
|
81
|
78
|
|
20
|
82
|
86
|
|
MEAN
|
97
|
96
|
|
MEDIAN
|
98
|
97
|
|
MODE
|
98
|
89
|
|
STD.DEV.
|
11.8
|
11.2
|
|
RANGE
|
43
|
46
|
|
CORREL VERB x RDG
|
|
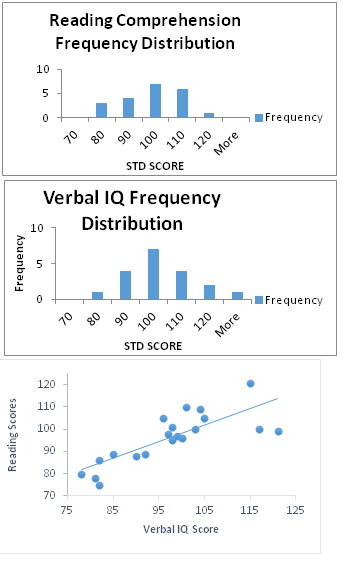
1. Using the provided data and graphs, describe the frequency distribution for the IQ test:
i. What is a typical score for this sample?
ii. How variable are the scores?
iii. How are the scores distributed?
2. Using the provided data and graphs, describe the frequency distribution of the reading test scores:
i. What is a typical score for this sample?
ii. How variable are the scores?
iii. How are the scores distributed?
3. Consider the correlation data given the provided data and graph:
i. How are IQ and reading achievement related?
4. Evaluate the data from a psychological testing perspective:
i. Are these samples good representations of the general population? How do you know?
ii. What could you do to make them a more representative sample?
iii. How would you interpret the correlation results?
iv. What are some ways this knowledge of their relationship could be used?
Format your assignment according to the following formatting requirements:
i) The answer should be typed, using Times New Roman font (size 12), double spaced, with one-inch margins on all sides.
ii) The response also includes a cover page containing the title of the assignment, the student's name, the course title, and the date. The cover page is not included in the required page length.
iii) Also include a reference page. The Citations and references must follow APA format. The reference page is not included in the required page length.