Question: Data entry clerks at the ARCO key in thousands of insurance records every day. They encompass just completed a new training program and wish for establish a control chart based on the outcomes of this training. Every day random samples of the work of clerks were collected. The outcomes are illustrated in the table below. 200 records were sampled each day and examined for the errors. The number of records with errors was counted.
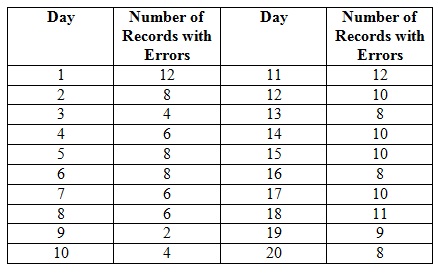
a) You desire to set control limits for the proportion of records with the errors. Suppose that the past 20 days performance is sufficient for establishing the control limits and performing the analysis. By using 95% control limits, determine the upper and lower control limits for the proportion of records with the errors? Compute your proportion defective and the lower and upper control limits to 3 decimal place. Suppose that the data given is adequate for performing the statistical analysis.
b) Plot the control chart and sample values.
c) What would you conclude regarding the process, in another word, is the process in control? Illustrate your thought.
d) Assume that the industry’s lower and upper control limits are 0.020 and 0.050 correspondingly. What can this insurance company conclude regarding its method relative to the industry standards?