Question 1) Using Octave, create and test set of programming statements to generate fs bandpass ranges (2fc -B)/m & 2fc + B)/(m+1)) along with minimum fs value (fs >=2B), and positioned sampled spectra for the following values and ranges of m and k:
B=5 MHz
fc = 16 MHz
m ranges from 1-6
k ranges from 1-6 for (Positioned Spectra)
Find out the optimum sampling rates, as applicable for each m value. Place the results in the neatly organized table in a word document. Make sure to include optimum sampling rate for each reasonable value of m in the table.
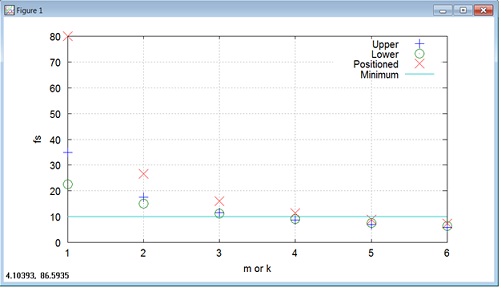
Plot your results, using Octave, showing each of the sampling frequencies. Include horizontal line indicating minimum fs. Ensure to include labels and legends for your plot. Example plot is shown below for fc = 20 MHz. You require to include the upper and lower sampling ranges as well as the positioned sampled spectra and fs .
Analyze results to summarize the findings and the recommendations on your findings. In your analysis ensure to discuss exactly how you find out the optimum sampling rates. For instance, how did you find out which spectral replication was located exactly at the baseband butting up against the zero HZ? Also, explain when the selected m values would cause aliasing and at what point fs is no longer greater than or equal to the 2B.