Question 1:
According to a recent survey, the average urban person consumes 1.5 kg of food per day. Is this figure also true for rural people? Suppose 64 rural people are identified by a random procedure and their average consumption per day is 1.57 kg of food. Assume a population variance of 0.52 kg2 of food per day. Use a 5% level of significance to determine whether the survey figure for urban people is also true for rural people on the basis of the sample data.
Question 2:
A study is conducted to estimate the average difference in bus use in a large city between the morning and afternoon rush hours. The transit authority's researcher randomly selects nine buses because of the variety of routes they represent. On a given day, the number of passengers on each bus is counted at 7.45 am and at 4.45 pm, with the following results:
|
Bus
|
Morning
|
Afternoon
|
|
1
|
43
|
41
|
|
2
|
51
|
49
|
|
3
|
37
|
44
|
|
4
|
24
|
32
|
|
5
|
47
|
46
|
|
6
|
44
|
42
|
|
7
|
50
|
47
|
|
8
|
55
|
51
|
|
9
|
46
|
49
|
a) Use the data to compute a 90% confidence interval to estimate the population average difference. Assume that the number of passengers is normally distributed.
Question 3:
Nowadays, there is a wide range of digital cameras available with many differentfeatures and price tags. The following table lists the prices and effective megapixels of some of these cameras. Suppose a potential buyer is interested in finding out if there is a positive relationship between effective megapixels and price.
a) Using thesedata, perform a simple regression analysis to predict the price of a digital camera using the number of effective megapixels. Interpret the slope term and state whether it is consistent with the buyer's prior belief.
b) Discuss the r2 and se. Several of these cameras have a resolution of 10 effective megapixels, but their price varies significantly from $999 to $2199. Provide an intuitive explanation as to why this might be the case.
|
Model
|
Price ($)
|
Effective megapticels
|
|
Canon PowerShot S5IS
|
599
|
8
|
|
Canon EQS 400 D + 18-55 mm EFS
|
1199
|
10.1
|
|
Canon EQS 400 D + 17-85 mm EFS IS USM
|
2799
|
10.1
|
|
Fujifilm Finepix S8000fd
|
649
|
8
|
|
Kodak Easyshare ZD170
|
299
|
7.1
|
|
Nikon D80 DX 18-70 mm
|
2198
|
10
|
|
Nikon D40x Kit DX 18-55 mm EDIT
|
999
|
10
|
|
Olympus E-140 Kit + 14-42 mm ED
|
999
|
10
|
|
Olympus E-510 Kit + 14-42 mm ED
|
1299
|
10
|
|
Olympus SP-560UZ
|
599
|
8
|
|
Panasonic Lumix DMC-L10 + Leica D14-50 mm
|
2199
|
10
|
|
Panasonic Lumix DMC-FZ18
|
769
|
8
|
|
Sony Alpha DSLR-A700 + 18-70 mm DT
|
2399
|
12.2
|
Question 4:
Study the following regression analysis to predict y using x.
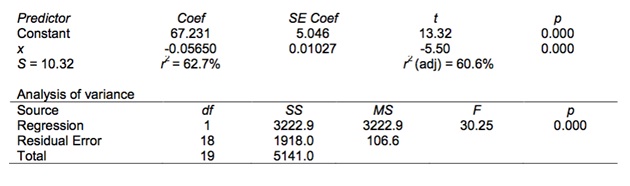
a) What is the equation of the regression model?
b) What is the meaning of the coefficient of x?
c) What is the result of the test of the slope of the regression model? Let α = .10. Why is the t statistic negative?
d) Comment on r2 and the standard error of the estimate.
e) The correlation coefficient for these two variables is -.7918. Is this result surprising to you? Why or why not?
Question 5:
What factors determine how happy workers are in their jobs?
a) Use the following data and multiple regression to produce a model to predict employee satisfaction. Comment on the results of the process.
|
Job
|
Relationship
ionship with ry
supervisor
|
Overall quality of Total hours
work environment worked per week
|
ies for Opportunities
advancement
|
|
55
|
3
|
6
|
55 4
|
|
20
|
1
|
1
|
60
|
3
|
|
85
|
4
|
8
|
45
|
1
|
|
65
|
4
|
5
|
65
|
5
|
|
45
|
3
|
4
|
40
|
3
|
|
70
|
4
|
6
|
50
|
4
|
|
35
|
2
|
2
|
75
|
2
|
|
60
|
4
|
7
|
40
|
3
|
|
95
|
5
|
8
|
45
|
5
|
|
65
|
3
|
7
|
60
|
1
|
|
85
|
3
|
7
|
55
|
3
|
|
10
|
1
|
1
|
50
|
2
|
|
75
|
4
|
6
|
45
|
4
|
|
80
|
4
|
8
|
40
|
5
|
|
50
|
3
|
5
|
60
|
5
|
|
90
|
5
|
10
|
55
|
3
|
|
75
|
3
|
8
|
70
|
4
|
|
45
|
2
|
4
|
40
|
2
|
|
65
|
3
|
7
|
55
|
1
|