Problem 1. This problem consists of two separate problems using the price elasticity of demand concept.
a. Suppose that you know that the market demand curve for a product is given by the equation P = 100 – 2Q. Furthermore you know that initially 40 units are demanded in this market when it is in equilibrium. Then, some event causes the equilibrium to change so that only 35 units are demanded in this market. From this information you are asked to calculate the price elasticity of demand using the arc elasticity concept. Finally you are asked to identify whether demand is elastic, unit elastic, or inelastic when quantity changes from 40 units to 35 units.
b. Suppose you know that the price elasticity of demand for good X has a value of 2. Suppose that the price in the market is initially $10 and the quantity demanded is 100 units. If price in this market decreases by 10%, what will be the percentage change in the quantity demanded given the above information?
Problem 2. Suppose the market demand and supply of widgets is given by the following equations:
Market Demand for Widgets: P = 100- Q
Market Supply of Widgets: P = 3Q + 20
where P is the price per unit and Q is the quantity demanded.
a. What is the equilibrium price and equilibrium quantity of widgets?
b. Describe what happened to the supply curve due to this change in production costs. What is the equation for the new supply curve?
Suppose that production costs increase in the market for widgets such that at every quantity the cost has now increased by $20.
c. Given the change in production costs described above, calculate the new equilibrium price and equilibrium quantity in the market for widgets.
d. Intuitively what do you think happened to total expenditure in this market given the increase in production costs? Explain your answer.
e. Calculate total expenditure in the market for widgets initially and total expenditure in the market for widgets after the increase in production costs.
f. Does your answer in (e) support or confirm your answer in (d)?
g. Calculate the value of the price elasticity of demand between these two points of equilibrium using the arc elasticity of demand formula.
Problem 3. Suppose the market for doughnuts has five consumers and each consumer’s demand for doughnuts can be described by the equation Pd = 5 – Qd where Pd is the price per doughnut and Qd is the quantity of doughnuts demanded.
a. What is the market demand curve for doughnuts?
Suppose the market demand and market supply curves for coffee are given by the following equations where Pc is the price per cup of coffee and Qc is the quantity of cups of coffee:
Market Demand for Coffee: Pc = 5 – (1/20)Qc
Market Supply of Coffe: Pc = 1 + (1/60)Qc
b. Suppose you know that the price of doughnuts is fixed at $1 per doughnut. How many doughnuts will be demanded in the market given this information?
c. What is the equilibrium price and equilibrium of coffee given the above information?
Suppose the quantity of coffee supplied at every price decreases by 20 units. Furthermore you are told that the cross-price elasticity of doughnuts for coffee has a value of -1.0.
d. What is the new supply equation for coffee given the above information?
e. Calculate the new equilibrium price and quantity in the coffee market.
f. Using the simple percentage change formula (the standard mathematical definition of percentage change), what is the percentage change in the price of coffee given your answers in (c) and (e)?
g. Using the simple percentage change formula (the standard mathematical definition of percentage change), what is the percentage change in the quantity demanded of coffee given your answer in (c) and (e)?
h. Calculate the price elasticity of demand for coffee using two different methods: a) use the simple percentage change formula to get an estimate of the price elasticity of demand; and b) use the arc elasticity formula to get a numerical value of the price elasticity of demand.
i. Given your values in (g), is demand for coffee inelastic or elastic over this range of prices? Explain your answer.
j. Calculate the percentage change in the quantity of doughnuts demanded given this change in the supply of coffee. What will be the new quantity demanded of doughnuts?
Problem 4. Suppose you are told that the price elasticity of demand for soft drinks is 2.0; the cross price elasticity of demand of soft drinks for iced tea is 1.5; the cross price elasticity of demand of soft drinks for popcorn is -2.0; and the income elasticity of demand for soft drinks is 1.2. Use this information to answer the following question.
a. Describe verbally the relationship between soft drinks and popcorn. In your statement describe how you know these two goods have this relationship.
b. Describe verbally the relationship between soft drinks and iced tea. In your statement describe how you know these two goods have this relationship.
c. Are soft drinks a normal or an inferior good given the above information? Explain your answer fully.
Problem 5. In Xenia the typical consumer purchases 10 pounds of potatoes, 2 pounds of coffee, and 5 bags of apples. Use this market basket and the following data for this question. (Hint: you will want to use a calculator or Excel for this question.)
Year Price of Potatoes Per Pound Price of Coffee Per Pound Price of a Bag of Apples Cost of Market Basket
1 $1 $2 X $34
2 $1 Y $3 $27
3 $2 $2 $4 Z
4 $3 $3 A $61
a. Fill in the missing cells in the above table.
b. Given the above data construct the CPI index for Xenia using year 1 as your base year and a 100 point scale. Carry out calculations to two places past the decimal. Show how you got these values and then enter your answers in the following table. (Hint: you will want to use a calculator on this problem.)
Year CPI with base year year 1
c) Now, recalculate the CPI using year 4 as your base year. Put your new CPI index numbers in the following table.
Year CPI with base year year 4
d) Joe lives and works in Xenia. He knows his nominal income per year over these four years and wants to calculate his real income. He asks you to help him out. Here is the data he provides you with for your analysis.
Year Nominal Income
1 $50,000
2 $50,000
3 $56,000
4 $60,000
He asks you to calculate his real income in year 1 dollars and his real income in year 4 dollars. He wants you to put your findings in the following table and also explain how you calculated his real income.
Year Nominal Income CPI: BY year 1 Real Income (BY: Year 1) CPI: BY year 4 Real Income (BY: Year 4)
1 $50,000
2 $50,000
3 $56,000
4 $60,000
e) Consulting your answer in (d), calculate the ratio of real income in year 1 to real income in year 4 using year 1 as the base year. Then calculate the ratio of real income in year 1 to real income in year 4 using year 4 as the base year. Compare your answers.
f) Calculate the general rate of inflation per year for Xenia based on the CPI. Enter your findings in the table below.
Year Rate of Inflation
1 ----
2
3
4
g) What does it mean if, when you calculate the annual rate of inflation, yet get a negative rate of inflation? Is a negative rate of inflation a good or bad outcome? Explain your answer fully.
h) Given your analysis has Joe’s nominal income kept up with the general rate of change in prices in Xenia over these four years? Explain your answer. If your answer is no, then calculate what his nominal income would need to equal in year 4 for his purchasing power in year 4 to be equal to his purchasing power in year 1.
Problem 6. In this problem the goal is to practice drawing budget lines from a given set of information and then to be able to generalize what you have learned from the exercise. Each question is independent of the rest of the questions.
a. Mary has income of $120 and she spends all of this income on either shoes (price of a pair of shoes is $40) or shirts (price of a shirt is $10). Draw Mary’s budget line, BL1, on a graph with shoes on the horizontal axis and shirts on the vertical axis. Write an equation for Mary’s BL1. Then, suppose that Mary’s income doubles: on your graph draw Mary’s BL2 based on this information. Write an equation for Mary’s BL2. In words describe any similarity between BL1 and BL2: explain why this similarity exists.
b. Susan has $150 to spend on sandwiches (S) and milk (M). The price of sandwiches is $5 per sandwich and the price of milk is $2 per carton. Given this information draw Susan’s budget line, BL1, on a graph with sandwiches on the horizontal axis and milk on the vertical axis. Suppose the price of sandwiches increases to $10 while everything else is held constant. Draw this new budget line, BL2, on your graph. Explain in words the effect of a change in the price of sandwiches on this budget line. Write equations for both BL1 and BL2.
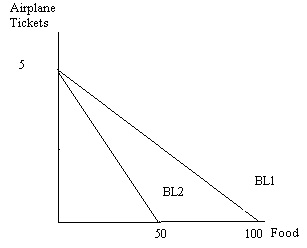
c. You are given the following graph of Jorge’s budget lines, BL1 and BL2. You know that Jorge’s income is $500 per day and that he spends all of his income on either airplane tickets (T) or food (F). From the graph, calculate the price of food as well as the price of an airplane ticket for BL1. Then, calculate the price of food as well as the price of an airplane ticket for BL2.
Problem 7: Suppose you are told that Mary’s utility function is given by the equation U = 2XY where U is the level of utility measured in utils and X and Y refer to good X and good Y respectively. You are also told that the marginal utility of good X can be expressed as MUx = 2Y; and the marginal utility of good Y can be expressed as MUy = 2X.
a. In a graph draw three indifference curves illustrating Mary’s utility from consuming different bundles of X and Y: draw an IC1 representing utility of 20 (U = 20); and IC2 representing utility of 40; and an IC3 representing utility of 80. Make sure for each IC you identify at least three distinct points that lie on that IC. You will find it helpful to complete a table like the following for each IC. (In the table I have provided one possible solution and proposed two other numbers to try.)
U = 2XY = 20
X Y
1 10
2 ?
? 5
b. Suppose you are told that Mary maximizes her utility at 40 utils when she selects 5 units of good X and 4 units of good Y when the price of good X is $4/unit of good X and the price of good Y is $5/unit of good Y. Prove that Mary is maximizing her utility given the information provided. Verbally as well as mathematically identify what must be true for Mary to be maximizing her utility.
c. Given the above information, calculate Mary’s income. Show how you found your answer.
d. Draw a graph illustrating Mary’s IC and her budget line as well as her utility maximizing bundle given the above information.
Problem 8. Use the graph below to answer this question.
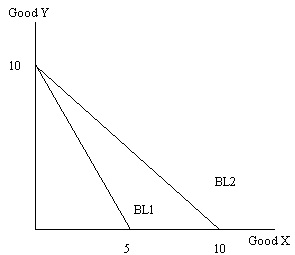
You are told that Wei’s income is $100 and he spends all of this income on either good X or good Y. BL1 is his initial budget line.
a. Given BL1 and the above information, what is the price of good X and the price of good Y?
b. The graph also depicts Wei’s BL2. What is a likely explanation for why Wei’s budget line changed from BL1 to BL2? Be specific in your answer.
c. Suppose you are told that Wei consumes 3 units of good X and 4 units of good Y when he maximizes his utility subject to his income and the prices of good X and good Y he faces with BL1. When Wei’s budget line is BL2, he maximizes his utility by consuming 8 units of good X. Given this information, how many units of good Y does he consume if he faces BL2 and he is maximizing his utility?
d. If we constrain Wei to have the same utility as he had when he faced BL1, but assume he is now facing the new prices of BL2, will this new BL (in class this was “BL3”) relative to BL2 reflect an increase or a decrease in income? Explain your answer.
e. Suppose you are told that on BL3 Wei maximizes his utility when he consumes the bundle (X, Y) = (5, 2). From the given information calculate Wei’s income and substitution effect. (Hint: you may find it helpful to draw a graph before answering this question.)
f. Given the above information, what is Wei’s adjusted income for BL3?
Problem 9. Mario’s Widgets produces widgets and his production function for these widgets is given by the equation:
W = 2K.5L.5
where W is widgets, K is capital, and L is labor. Mario’s Widgets uses only capital and labor to produce the widgets. In the short run, Mario’s Widgets capital is equal to 4 units. Mario’s Widgets pays $10 per unit of capital and $20 per unit of labor. Use this information to answer this set of questions. Hint: you will find it helpful to use Excel to do this set of questions.
a. In the short run, what is the fixed cost associated with widget production?
b. For the short run, write an equation for Mario’s Widgets variable cost of widget production.
c. For the short run, write an equation for Mario’s Widgets total cost of production.
d. Complete the following table given the above information. All calculations should be rounded to two places past the decimal. (Hint: this is where you will want to start using Excel.)
L K W MPl VC FC TC AVC AFC ATC MC
0
1
4
9
16
25
36
49
64
81
100
Problem 10. Consider a production function for a firm:
Q = 2K1/2L1/2
where Q is output, K is capital, and L is labor. Suppose initially K is equal to 25 units and L is equal to 16 units. You also know that the price of K, Pk, is $10 per unit of K and the price of L, Pl, is $4 per unit of L.
a. Given the above information, what is the value of output?
b. What is the total cost of producing the output you calculated in (a)?
c. What is the average total cost of producing this level of output?
d. Suppose the amount of labor increases to 32 units and the amount of capital increases to 50 units. Given this information, what level of output can the firm now produce? (Hint: you can do this without a calculator – and, then you can check your answer with a calculator!)
e. Given the information in (d), what is the total cost for the firm of producing this level of output?
f. Given the information in (d) and (f), calculate the firm’s average total cost of producing this new level of output.
g. Given your answer to the above set of questions, what can you conclude about returns to scale for this firm?
Problem 11. Consider a production function for a firm:
Q = 2KL1/2
where Q is output, K is capital, and L is labor. Suppose initially K is equal to 25 units and L is equal to 16 units. You also know that the price of K, Pk, is $10 per unit of K and the price of L, Pl, is $4 per unit of L.
a. Given the above information, what is the value of output?
b. What is the total cost of producing the output you calculated in (a)?
c. What is the average total cost of producing this level of output? Round your answer to the nearest hundredth.
d. Suppose the amount of labor increases to 32 units and the amount of capital increases to 50 units. Given this information, what level of output can the firm now produce? (Hint: you can do this without a calculator – and, then you can check your answer with a calculator!)
e. Given the information in (d), what is the total cost for the firm of producing this level of output?
f. Given the information in (d) and (f), calculate the firm’s average total cost of producing this new level of output.
g. Given your answer to the above set of questions, what can you conclude about returns to scale for this firm over the range of output you have considered?