Discussion:
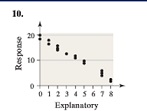
Q1. Determine whether the scatter diagram indicates that a linear relation may exist between the two variables. If the relation is linear, determine whether it indicates a positive or negative association between the variables.
Q2. The TIMMS Exam Part II : For the 41 nations that participated in TIMMS, the correlation between the percentage of students who skipped class at least once in the past month and the mean score on the exam was -0.52. Does this suggest there is a linear relation between attendance and achievement score? Write a sentence that explains what this result mi. ht mean.
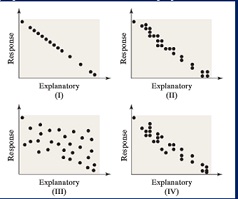
Q3. Match the linear correlation coefficient to the scatter diagram. The scales on the x- and y-axes are the same for each diagram.
(a) r = -0.969 (b) r = -0.049 (c) r = -1 (d) r = -0.992