Discuss teh below:
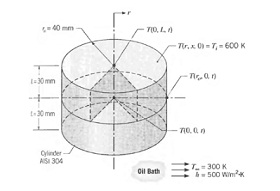
Q: 1n a manufacturing process, stainless steel cylinders (AISI 304) initially at 600 K are quenched by submersion in an oil bath maintained at 300 K with h = 500 W/m2 · K. Each cylinder is of length 2L = 60 mm and diameter D = 80 mm. Use the ready-to-solve model in the Examples menu of FEHT to obtain the following solutions.
(a) Calculate the temperatures, T(r, x, t), after 3 min at the cylinder center, T (0, 0, 3 min), at the center of a circular face, T(0, L, 3 min), and the mid height of the side, T(r0, 0, 3 min).
(b) Plot the temperature history at the center. T(0, 0, t), and at the mid height of the side, T(ro, 0, t) for 0 < t="">< 10="" min="" using="" the="" view/temperatures="" vs.="" time="" command,="" comment="" on="" the="" gradients="" occurring="" at="" these="" locations="" and="" what="" effect="" they="" might="" have="" on="" phase="" transformations="" and="" thermal="">
(c) Having solved the model for a total integration time of 10 min in part (b), now use the View/ Temperature Contours command with the shaded band option for the isotherm contours. Select the From Start to Stop time option, and view the temperature contours as the cylinder cools during the quench process. Describe the major features of the cooling process revealed by this display. Use other options of this command to create a 10-isotherm temperature distribution for t = 3 min.
(d) For the location of part (a), calculate the temperatures after 3 min if the convection coefficient is doubled (h = 1000 W/m2 · K). Also, for convection coefficients of 500 and 1000 W/m2 · K. determine how long the cylinder needs to remain in the oil bath to achieve a safe-to-touch surface temperature of 316 K. Tabulate and comment on the results of parts (a) and (d).