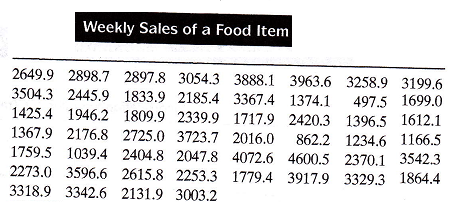
Table contains the weekry sares for a food item for 52 consecutive weeks.
a. Plot the sales data as a time series.
b. Do you think this series is stationary or nonstationary?
c using Minitab or a similar program, compute the auto correlations of the sales series for the first 10 time lags. Is the tehavior of the autocorrelations consistent with your choice in part b? Explain.