Discuss the below:
Coin Toss Simulation
Q1. Toss a coin 10 times, and after each toss record in the following table the result of the toss and the proportion of heads so far. For example, consider the sequence of tosses: H T T T H. After the first toss, the proportion of heads was 1/1, after the second the proportion of heads was 1/2, then after the third toss it was 1/3, 1/4 after the fourth, and finally 2/5 after the fifth toss.
|
Toss Number
|
1
|
2
|
3
|
4
|
5
|
6
|
7
|
8
|
9
|
10
|
|
Heads or Tails?
|
h
|
h
|
h
|
t
|
h
|
t
|
t
|
t
|
h
|
h
|
|
Proportion of H so far
|
1
|
2
|
3
|
3/4
|
4/5
|
4/6
|
4/7
|
4/8
|
5/9
|
6/10
|
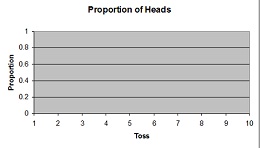
Q2. On the following axes, plot the proportion of heads so far, for each toss from your table. What does your graph show?

Q3. If you wanted to simulate coin tossing in Excel, you could use its =rand() function. rand() produces a random decimal number between 0 and 1. So if we generate a random decimal which is between 0 and 1, and multiply it by 2, the result is between 0 and 2. Then we could take the integer part of this number to get either a 0 or a 1. We can let the 0 represent a "tails," and 1 represent a "heads."
So, if rand() generates 0.13061, what value is produced when you multiply it by 2 and take the integer part?
So, if rand() generates 0.7893, what value is produced when you multiply it by 2 and take the integer part?