Solve the following:
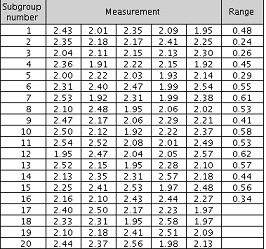
Q: A metal stamping machine is used to form key blanks that will eventually be machined with different combinations of grooves and teeth to become finished keys for automobile door locks. Every 15 minutes a subgroup of 5 key blanks is taken, and the length of each key is measured. The table shows these measurements (in inches) for the most recent 20 subgroups of data:
1. Complete the table with the ranges for the last four subgroups (from 17 to 20), and plot them on the R chart. Explain in detail exactly how you computed the ranges for the last four subgroups.
2. Plot the centerline, upper control limit (UCL), and lower control limit (LCL) for the R chart. Carry your intermediate computations to at least three decimal places.