I would like this to be resolved by means of the work attached. As well, if excel was used I want an attachment of the excel file.
Exercises on Simple Regression:
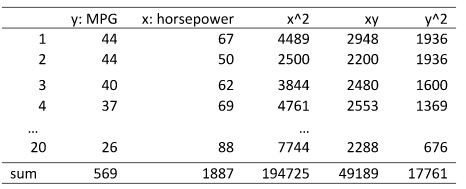
Fuel efficiency (as measured by miles per gallon of gasoline or MPG) is one of the most important factors when people are purchasing a car and is often displayed on the window sticker on the new car. The MPG is related to several factors, one of which is the horsepower of the automobile. Researchers at a Motor company have been asked to study the impact of horsepower on MPG. A sample of 20 automobiles is selected, and their MPG and horsepower are recorded.
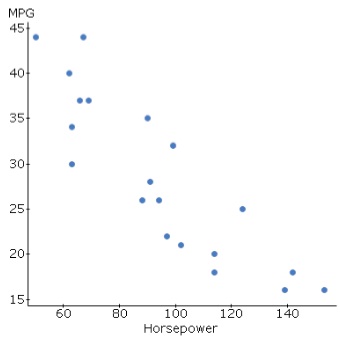
a. The scatterplot of MPG vs. horsepower is copied below. Does it appear to be a linear relationship? Is there a strong positive linear relationship or strong negative linear relationship? Write down the linear model we are trying to fit.
b. Use the data to estimate the model parameters. By your estimate, how many more or less miles the automobile can run with one gallon of gasoline, if the horsepower is increased by 1?
c. Based on the following output, 70% of the time, the observed dots in the scatterplot will be within ______ of the regression line?
Simple linear regression results:
Dependent Variable: MPG
Independent Variable: Horsepower
Estimate of error standard deviation: 4.4812784
d. Generally people believe that the higher the horsepower, the less fuel efficient the car is. Write down the null and alternative hypotheses to test whether MPG will decrease linearly as the horsepower increases.
e. Fill in the missing values in the following table. What is the p-value for the test in part d? (an inequality will work) Are you going to reject the null hypothesis or not?
What is the 90% confidence interval for the slope?
Parameter estimates:
Parameter Estimate Std. Err. Alternative DF T-Stat P-Value
Intercept 3.4230599 ≠ 0 15.738076 <0.0001
Slope 0.0346911 ≠ 0 <0.0001
f. What is the R^2 of the model? How would you interpret the R^2?
g. What would be your forecast for its MPG for a car with 100 horsepower? What would be the average MPG of all cars with 100 horsepower? What is the 95% confidence interval for each of your prediction?
Predicted values:
X value Pred. Y s.e.(Pred. y) 95% C.I. for mean 95% P.I. for new
100 1.0210341 (24.782508, 29.072734) (17.271521, 36.583722)
h. Bonus question: fill in the missing values in the ANOVA table
Analysis of variance table for regression model:
Source DF SS MS F-stat P-value
Model 1211.48 <0.0001
Error 361.47 n/a n/a
Total 1572.95 n/a n/a n/a