Question 1: Out of a long-term record of precipitation for four adjacent stations you find that records of one station (station D) are missing for the spring months, September, October, and November for the year 2011. For those three months the other three stations recorded the following total depth in mm.
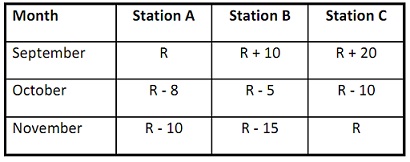
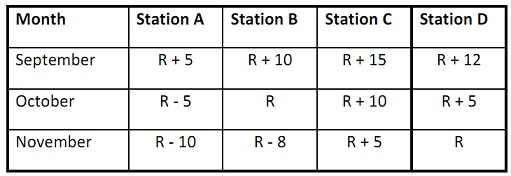
Estimate the missing precipitation if the long-term average precipitations for the three months in all four stations are:
An alternative way of estimating a missing record is by weighting observations by the inverse square distance to the point of the missing record. If the distance of the station D from stations A, B, and C are 5 km, 1 km, and 10 km respectively, compute the missing records for the station D.
Question 2:
a) Average rainfall during the month of January is found to be R mm. A Class A pan evaporation recorded an average of [7 + (R/100)] mm/day near an irrigation reservoir. The average January inflow into the reservoir is (100 + R) m3/s and the average irrigation demand during the month is 170 m3/s. The water level drops by (10 times R) mm in that month and the average surface area of the reservoir is 21,000 ha. Estimate the seepage through the banks and the dam during this month. Assume the pan coefficient of 0.7 for the month of January.
b) Calculate the evaporation in mm/day from the free water surface using Penman’s method.
The following data were measured on that day:
Net Radiation = (100 + R) W/m2
Air Temperature = 200C
Humidity = R %
Wind run = 20 km/day measured at 2 m above the surface
The wind function f(u) can be calculated as 73 + 0.44 u, when u is in km/day
Vapour pressures is in kPa and γ can be taken as 0.065 kPa/0C
Question 3: Show that the infiltration volume estimated using Horton’s infiltration equation between times t1 and t2 is given by;
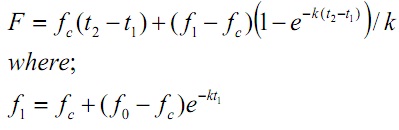
Use the above concept in answering the following question.
In a small watershed with homogeneous soil, runoff from two storms separated by an interval of 3 hours was monitored. The infiltration capacity of the soil at the beginning of the first storm was observed to be at its maximum capacity. Given the following information, determine the runoff for the first burst and the rate of infiltration recovery between the two storms.
Storm intensities:
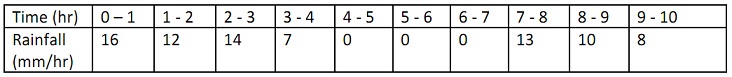
Infiltration capacity: fo = 14 mm/hr, fc = 4.0 mm/hr, k = 0.6 hr-1
The surface runoff for the second storm was measured as Y mm at the outlet of the watershed, where Y is given by:
If your R value is between 45 and 55 (both inclusive), then Y = 15.5 mm
If your R value is between 56 and 66 (both inclusive), then Y = 16.0 mm
If your R value is between 67 and 77 (both inclusive), then Y = 16.5 mm
If your R value is between 78 and 88 (both inclusive), then Y = 17.0 mm
If your R value is between 89 and 99 (both inclusive), then Y = 17.5 mm
Question 4:
a) Rainfall intensities for every 10 min increments of a 60 min storm are given in sequence as: 102, 78, 90, 72, 56 and 45 mm/hr.
The infiltration capacity for the given soil type and cover is known to decrease at the following rate:
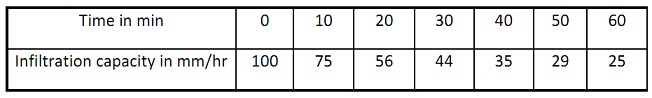
Determine:
i) the surface runoff for every 10 min increments
ii) the runoff volume for the storm
iii) Φ-index for the storm. Infiltration capacity at the start of the storm may be assumed as 100 mm/hr.
Note: The area under the infiltration capacity curve may be computed using the trapezoidal rule for every 10 min increments.
b) The following data were obtained by stream gauging of a river:
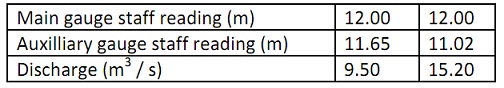
What should be the discharge when the main gauge reads 12 m and the auxiliary gauge reads [10.7 + (R/100)] m ?
Question 5: At the outlet of a catchment with area of 182.3 km2, direct runoff flood hydrograph (total runoff minus the base flow hydrographs) resulting from a 2-hr uniform rainfall excess is presented in the following table.
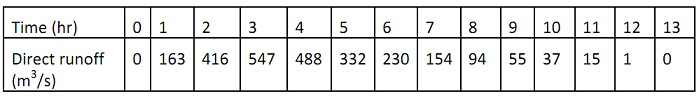
a) Calculate the rainfall excess (in cm) for the above runoff hydrograph.
b) Using the value in Part (a) calculate the unit hydrograph of 2-hr duration (that is for 1cm of rainfall excess in 2 hours).
c) From the 2-hr unit hydrograph in Part (b), calculate the 1-hr unit hydrograph.
d) Using the 1-hr unit hydrograph of Part (c), estimate direct runoff flood hydrograph for a storm with the rainfall excess distribution of (R/100) cm and (R/50) cm during the first
and the second 1-hr time steps respectively.
e) What would be the direct runoff flood peak if the total depth of rainfall excess (i.e. 3R/100 cm) in section (d) is used in association with 2-hr unit hydrograph?
f) Compare the results for direct runoff flood peaks in sections (d) and (e) and discuss the difference.