Assignment:
Part I: Material Questions
1. Forest Green Brown, Inc., produces bags of cypress mulch. The weight in pounds per bag varies, as indicated in the accompanying table.
Weight in pounds 44 45 46 47 48 49 50
Proportion of bags 0.10 0.07 0.21 0.29 0.15 0.10 0.08
(a) Calculate the mean of the weight per bag.
(b) Calculate the standard deviation of the weight per bag.
2. A client has an investment portfolio whose mean value is equal to $1,000,000 with a standard deviation of $30,000. He has asked you to determine the probability that the value of his portfolio is between $970,000 and $1,060,000.
3. What not to get them on Valentine's Day! A recent study among adults in the USA shows that adults prefer not to receive certain items as gifts on Valentine's Day; namely, Teddy bears: 45%; Chocolate: 25%; Jewelry: 15%; Flowers: 12%; Don't Know: 3%. A Pareto diagram picturing the "Unwanted Presents" is as shown below.
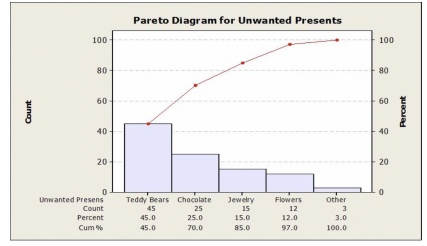
(a) If you want to be 80% sure you did not get your valentine something unwanted, what should you avoid buying? How does the Pareto diagram show this?
(b) 400 adults are to be surveyed, what frequencies would you expect to occur for each unwanted item listed on the snapshot?
PART II: Essay Questions
1. Individuals living in high-overty areas perform worse than those living in low-poverty areas on a wide range of outcomes such as earnings, health conditions and education levels. Motivated by such disparities, the U.S. Department of Housing and Urban Development (HUD) offered housing vouchers to low-income families. These housing vouchers pay a large portion of the rents and utilities (e.g. Section 8). Image that you are a policy maker trying to evaluate the effectiveness of the housing vouchers.
Suppose you are most interested in the long-term impacts of housing vouchers on children who were young when their families received the voucher.
(a) You want to focus on the impact of housing vouchers on children's future earnings. Your colleague, another policy maker, suggests you to compare the average future earnings for children whose families received a housing voucher with those whose families didn't received a housing voucher. Do you think your colleague's suggestion is a good idea? Why?
(b) Your economist colleague suggests you to conduct a randomized experiment, i.e. randomly select children from high-poverty areas, flip a coin to determine who gets a housing voucher and then follow them 15-20 years to obtain their adult earnings. Do you think your economist
colleague's suggestion is a good idea? Why?
(c) Can we use randomized experiments to solve all policy related questions? List two limitations of randomized experiments.
In the mid-1990s, HUD conducted the Moving to Opportunity (MTO) experiment. MTO randomly selected 4,600 families living in high-poverty (i.e. area poverty rate is above 40%) public housing projects and randomly assigned these families to one of the following three groups:
• The experimental group: received housing vouchers that subsidized private-market rents and could initially (for the first year) only be used in census tracts with 1990 poverty rates below 10 percent.
• The Section 8 group: received regular housing vouchers without any MTO-specific relocation constraint.
• Control group: received no assistance through MTO.
"Previous research evaluating the MTO experiment has found that moving to lower-poverty areas greatly improved the mental health, physical health, and subjective well being of adults as well as family safety" (Chetty et al 2016). But these studies have found no impact of MTO on the earnings and employment status of adults and older youth.
Raj Chetty, Nathaniel Hendren, and Lawrence F. Katz (2016) study the impacts of MTO on children who were young when their families received the housing voucher. The graphs in the next page summarize their findings. In each graph, there are three bars. The bar on the very left shows the average outcome (e.g. average earnings in panel a) for the control group. The bar in the middle shows the average outcome for the Section 8 group and the bar on the very right shows the average outcome for the experimental group. The solid black vertical lines present 95% confidence intervals.
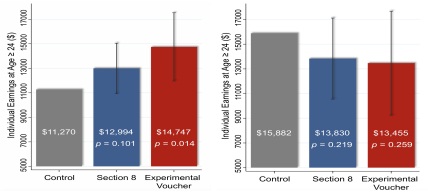
(a) Children Below Age 13 at Random Assignment
(b) Children Above Age 13 at Random Assignment
(c) For children below 13 at MTO random assignment, do you observe a statistical difference in individual earnings between the control group and the experimental group? What about between the control group and the Section 8 group? Please justify your answer.
(d) Now focus on children above 13 at MTO random assignment. Do you observe a statistical di↵erence in individual earnings between the control group and the experimental group?
What about between the control group and the Section 8 group? Please justify your answer.
2. Surely one of the biggest news stories of the 2000s was the housing bubble, the huge run-up in housing prices followed by a spectacular crash that triggered chaos in the financial system and a deep recession.
There are several data controversies related to the housing crisis, including the size of the bubble, how long it lasted, and whether it could have been foreseen. Analysis of these issues varies, depending on how one looks at the data. One way to measure the magnitude of the bubble, and to assess whether the market is back to "normal," is simply to examine the overall trend in housing prices. But which measure of housing prices should be used? Standard & Poor's Case-Shiller Index and the house price index produced by the Federal Housing Finance Agency (FHFA) are two popular measures of housing prices. More details about the two indices are as follows:
Standard & Poor's Case-Shiller Index:
• Data are collected from county recorder and assessor oces
• Data include all sales transactions, including those financed with subprime mortgages
• The smallest regions covered are metropolitan areas
FHFA's Index:
• Data are collected from Fannie Mae and Freddie Mac
• Data include only transactions involving conventional conforming mortgages.
• The smallest regions covered are metropolitan areas.
Figure 1 illustrates the housing price trends between 2000 and 2011 using the Case-Shiller index (dashed line) and the FHFA's index (solid line). The larger the index, the higher the housing price.
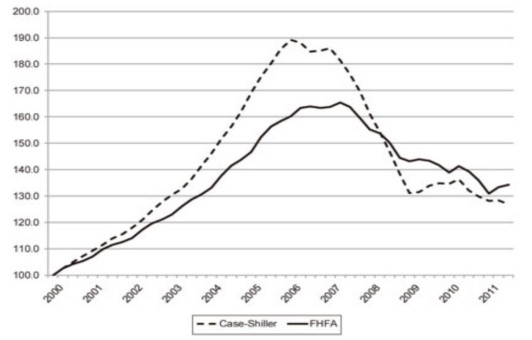
Source: Federal Housing Finance Agency price index "Housing Price Index," Case-Shiller index in Standard and Poor's, "S&P/Case-Shiller Home Price Indices,"
A subprime mortgage is a type of mortgage that is normally issued by a lending institution to borrowers with low credit ratings.
A conforming loan is a mortgage loan that conforms to GSE guidelines. The most well-known guideline is the size of the loan, which as of 2018 was generally limited to $453,100 for single family homes in the continental US.
(a) Please use the information above to explain why compared to the FHFA's index, the Case-Shiller index shows bigger increases in prices before the housing market crashed (i.e. before 2008) and larger declines after the housing market crashed.
(b) Based on the information given in the question, list one common issue of the two indices.