Managerial Economics and Business Strategy by Baye.
Problem 1: In the following figure, a consumer is initially in equilibrium at point C. The consumer's income is $400, and the budget line through point C is given by $400 = $100X + $200Y. When the consumer is given a $100 gift certificate that is good only at store X, she moves to a new equilibrium at point D.
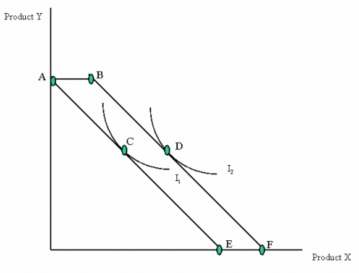
a. Determine the prices of goods X and Y.
b. How many units of product Y could be purchased at point A?
c. How many units of product X could be purchased at point E?
d. How many units of product X could be purchased at point B?
e. How many units of product X could be purchased at point F?
f. Based on this consumer's preferences, rank bundles A, B, C, and D in order from most preferred to least preferred.
g. Is product X a normal or an inferior good?
Problem 2: A consumer's budget set for two goods (X and Y) is 600 ≥ 3X + 6Y.
a. Illustrate the budget set in a diagram.
b. Does the budget set change if the prices of both goods double and the consumer's income also doubles? Explain.
c. Given the equation for the budget set, can you determine the prices of the two goods? The consumer's income? Explain.