Discuss the below:
Q: A nurse measured the blood pressure of each person who visited her clinic. Following is a relative-frequency histogram for the systolic blood pressure readings for those people aged between 25 and 40. Use the histogram to response the questions below. The blood pressure readings were given to the nearest whole number.
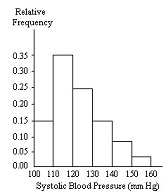
1. Approximately what percentage of the people aged 25-40 had a systolic blood pressure reading between 110 and 119 inclusive? ______
A) 3.5%
B) 0.35%
C) 35%
D) 30%
2. Approximately what percentage of the people aged 25-40 had a systolic blood pressure reading between 110 and 139 inclusive? ______
A) 74%
B) 59%
C) 89%
D) 39%
3. What common class width was used to construct the frequency distribution? ______
A) 100
B) 9
C) 11
D) 10
4. Identify the center of the third class. ______
A) 130
B) 125
C) 120
D) 124