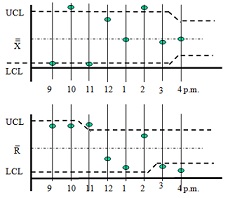
How to change the control limits on x-bar chart


Discuss the below:

Questions:

What happened at different times during this shift?

Why did management change the UCL in the R chart just after 10 a.m.?

Why did it change the LCL in the R chart after 2 p.m.?

Why did it change the control limits on x-bar chart at 3 p.m.?

1347_ucl.jpg

Solution Preview :

Prepared by a verified Expert
Basic Statistics: How to change the control limits on x-bar chart
Reference No:- TGS01891674

Now Priced at $25 (50% Discount)

Recommended (92%)

Rated (4.4/5)