Response to the following problem:
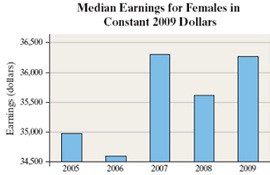
Median Earnings The graph in the next column shows the median earnings for females from 2005 to 2009 in constant 2009 dollars.
(a) How is the bar graph misleading? What does the graph seem to convey?
(b) Redraw the graph so that it is not misleading. What does the new graph seem to convey?