Mini Case:
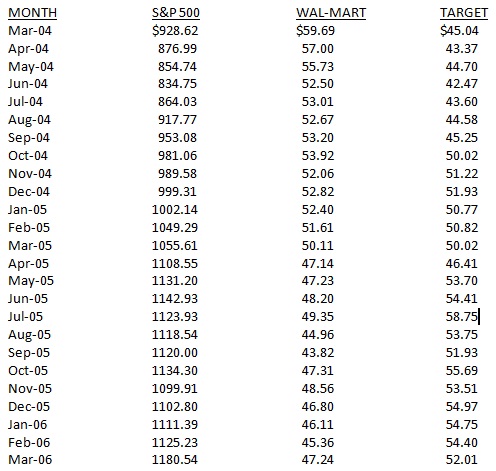
a) Use the price data from the table (attached) for the Standard & Poor’s 500 Index, Wal-Mart, and Target to calculate the holding-period returns for the 24 months from March 2004 through March 2006.
b) Calculate the average monthly holding-period returns and the standard deviation of these returns for the S&P Index, Wal-Mart, and Target.
c) Plot (1) the holding-period returns for Wal-Mart against the Standard & Poor’s 500 Index, and (2) the Target holding-period returns against the Standard & Poor’s 500 Index.
d) From your graphs in part c, describe the nature of the relationship between stock returns for Wal-Mart and the returns for the S&P 500 Index. Make the same comparison for Target.
e) Assume that you have decided to invest one-half of your money in Wal-Mart and the remainder in Target. Calculate the monthly holding-period returns for your two-stock portfolio. (The monthly return for the portfolio is the average of the two stocks’ monthly returns.)
f) Plot the returns of your two-stock portfolio against the Standard & Poor’s 500 Index as you did for the individual stocks in part c. How does this graph compare to the graphs for the individual stocks? Explain the difference.
g) The following table shows returns on an annualized basis that were realized from holding long-term government bonds for the same period. Calculate the average monthly holding-period returns and the standard deviations of these returns. (You will need to convert the annual returns to monthly returns by dividing each return by 12 months.)
MONTH & YEAR ANNUALIZED RATE OF RETURN (%)
Apr-04 4.50%
May-04 4.66
Jun-04 4.62
Jul-04 4.47
Aug-04 4.13
Sep-04 4.12
Oct-04 4.03
Nov-04 4.36
Dec-04 4.22
Jan-05 4.13
Feb-05 4.36
Mar-05 4.50
Apr-05 4.20
May-05 4.01
Jun-05 3.94
Jul-05 4.29
Aug-05 4.02
Sep-05 4.33
Oct-05 4.56
Nov-05 4.50
Dec-05 4.39
Jan-06 4.53
Feb-06 4.55
Mar-06 4.86
h) Now assuming that you have decided to invest equal amounts of money in Wal-Mart, Target, and long-term government securities, calculate the monthly returns for your three-asset portfolio. What is the average return and standard deviation?
i) Make a comparison of the average returns and the standard deviations for all the individual assets and the two portfolios that were designed. What conclusions can be reached by your comparison?
j) According to Standard & Poor’s, the betas for Wal-Mart and Target are 0.59 and 1.02, respectively. Compare the meaning of these betas relative to the standard deviations calculated above.
k) The Treasury bill rate at the end of March 2006 was 4.5 percent. Given the betas for Wal-Mart and Target and using the above data for the S&P Index as a measure for the market portfolio expected return, estimate an appropriate required rate of return given the level of systematic risk for each stock.