Complete the following:
1. If the scores in a sample have been organized into a frequency distribution table, the number of scores (n) can be obtained by adding the values in the f column.
True
False
2. To find â?'X for the scores in a frequency distribution table, you simply add the values in the X column.
True
False
3. A grouped frequency distribution table lists one interval as, 20?24. The width of this interval is 4 points.
True
False
4. In a negatively skewed distribution, the scores pile up on the right-hand side and taper off toward the left-hand side.
True
False
5. For this distribution, the individual with the highest score has a value of
X = 25
X = 24
X = 6
cannot be determined from the information given
6. What type of frequency distribution graph is shown in the figure on the left side?
cumulative graph
bar graph
histogram
polygon
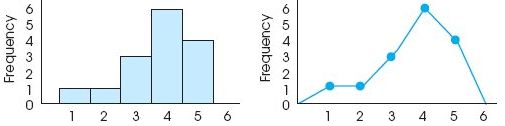
7. What type of frequency distribution graph is shown in the figure on the right side?
cumulative graph
histogram
bar graph
polygon
8. What is the best description for the shape of this distribution?
normal
positively skewed
negatively skewed
symmetrical
9. In this distribution, how many individuals had a score of X = 2?
3
1
0
2
10. What shape would you expect for the distribution of scores from a very easy exam for a large class of students?
positively skewed
symmetrical
negatively skewed
normal