Question 1: Consider the follow age-structured population graph for female endangered black-footed ferrets:
a) Ferrets begin reproduction at the end of their first year. On average, first year breeders produce 1.5 female offspring, second year breeders produce 1.7 and third year breeders produce 1.75. Estimates of survival rates are 0.464, 0.534, and 0.346 for first three years Correspondingly.
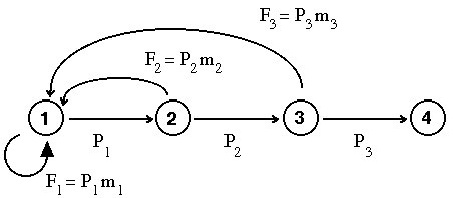
b) /textitCLEARLY describe what is going on the graphical model of the ferret life-cycle. How long to ferrets live? What are the population classes being considered?
Why is there a self-loop in the first age-class? What does the oldest group do?
c) /textitCLEARLY describe why the fertilities (fecundities, Fi) have the form given.
Think a bit. For graph shown, when (in time) should one conduct censuses to find out the parameters?
d) Translate the life-cycle graph into a matrix model.
Xi+1 = AXi
What does the discrete time unit, i → i + 1 represent in reality? What are the entries in matrix A?
e) Write a MatLab script to numerically find out the time evolution of the female ferret population. Start from some initial condition, say: One female in each age class. Plot the ratio of one year-old ferrets to 2 year-old ferrets as a function of time. What happens to this ratio? Modify the initial condition and redo. Does the ratio change? Plot the percent increase or decrease in population as a function of time. (In another words, plot Number (t+1)/Number(t) as a function of time).
What happens to this ratio as time increases?
f) Use MatLab to find out the eigenvalues and eigenvectors of the Matrix A. What do such objects say about the population? In particular, compare the structure of the eigenvector related with the largest eigenvalue to what your model shows for the population structure.
g) Use matlab script sensitivity.m to find out the sensitivity and elasticity matrices for A. What element of A is the eigen value most sensitive to? Does this element have a biological meaning? What non-zero element of A produces the largest proportional change in the eigenvalue?
h) Describe, clearly, what this implies for conservation efforts of the ferret population.
Question 2: Load the data in the file: MatrixModels.mat into MatLab. To do this, simply type:
>> load(’MatrixModels.mat’)
at the MatLab prompt. This must give you access to some matrices: P is a 10 x 10 model of the US human population based on 5 year age classes using best ?t 1971 data. W is a 4 x 4 model of the Killer-Whale population from Brault and Caswell (Research paper available on the MathBio Website).
a) You must be familiar enough now with matrix population models to understand what such folks are trying to do. For both models, rewrite the matrix model as an age-structured graph (like the one shown for Ferrets). What is the essential difference between the Killer-Whale and Human models?
b) We want to compare the two models:
i) What does each model predict for the population? Growth or Decay?
ii) Make a plot of the equilibrium structure of the population for each. (Use the number of first phase population for the comparisons .... that is, plot ration of number in each age class to number in first age class). Are the whole age structures of Killer-Whale and Human populations similar? Different? Describe.
iii) Do elasticity analysis of the two models. For each, plot the elasticity of the principal eigenvalue to Fecundities and Survivorships of each phase. Are the results similar or different for the Killer-Whales and Humans? Describe.
Question 3: Indicate whether each of the given difference equations is linear or nonlinear. If linear, solve the equation and state whether the solution decays or grows with increasing n. If nonlinear, find All the equilibrium solutions.
a) xn+1 = rxn (1 - x2n)
b) xn+1 = 3xn - xn-1
c) xn+1 = (xn)/(1 + xn)
d) xn+1 = rxn(α - x2n, α = constant
Question 4: Find out the equilibrium values and thier stability for the given nonlinear difference equation:
xn+1 = - (xn2/2) (1 - xn)
Here α represents the maximal growth rate of the organism and is the inhibition of growth caused by the overpopulation.
a) Use MatLab to sketch a graph of the population dependent growth rate. Find out how this graph changes with changes to α and β.
b) Find out all the steady state (equilibrium) populations:
c) Find out the conditions for each steady state to be stable.
d) Write a matlab script similar to logmap.m to simulate the Ricker Equation. Explain the results determined above with Matlab. (In another words, use the program to show that the steady state is stable or unstable depending on the size of |1 - ln α|).
Question 5: A frequently encountered difference equation model for a single population is mainly based on an the logistic growth observed in continuous models.
Nn+1 = Nner(1-Nn/K)
a) The idea here is that the environment has a Carrying Capacity given by the value of K. Analyze the model to ?nd out the steady states, then describe, in words, what K is and why it is called the Carrying Capacity. Be clear enough that a mathematcian can understand!
b) Rewrite the equation to look like:
Nn+1 = R(Nn)Nn
where R(N) is the population dependent growth rate. Use MatLab to sketch a graph of the population dependent growth rate as a function of population. What is the maximum value of R? For what values of thepopulation does the population grow? Find out how this graph changes with changes to r and K.
c) Do some analysis: Find out the conditions for each steady state to be stable.
d) Write a matlab script like logmap.m to simulate the Equation. Explain the results determined above with Matlab. (In another words, use the program to show that the steady state is unstable or stable for different values of r and K.
Question 6: Read the paper A Stage-Based Population Model for Loggerhead Sea Turtles and Implications for Conservation by Deborah T. Crouse, Larry B. Crowder and Hal Caswell. You can download this from:
https://www.math.csi.cuny.edu/~poje/Teach/LoggerHeadTurtles.pdf
a) You must be familiar enough now with matrix population models to understand what such folks are trying to do. What is thier model? Write down the matrix model they study. How many age classes do they use? Why did they pick these?
How did they estimate parameters?
b) Write a MatLab script to calculate the evolution of the modeled logger head turtle population. In another words, use MatLab to solve:
Xi+1 = AXi
where A is given in Crouse, Crowder and Caswell. Plot the time evolution of the population and the evolution of the age structure of the population (that is, number of eggs/mature breeder, number of novice breeders/mature breeder and so on).
c) Use MatLab to ?nd out the eigenvalues and eigenvectors of the matrix. Relate such to what you found in the simulations.
Question 7: Consider the given discrete time population model for a single species
Nt+1 = (rNt)/(Nt)b
a) What is being modeled here? What is the population-dependent growth rate function? Plot this function by using matlab for di�erent values of r and b
b) Explain in words what the parameters r and b represent biologically.
c) Find out all steady state solutions to the model.
d) Find out the stability of each steady state.
f) Given r = 6 and b = 1:5, what would you expect the model to predict the population. Sketch a graph of N versus t.
d) Given r = 6 and b = 2:1, what might you expect the model to predict for population. Sketch a graph of N versus t.